I'm just curious to see what everyone's set up looks like. I hope we can use this as a forum to learn from each other and to brag about our beautiful dashes.

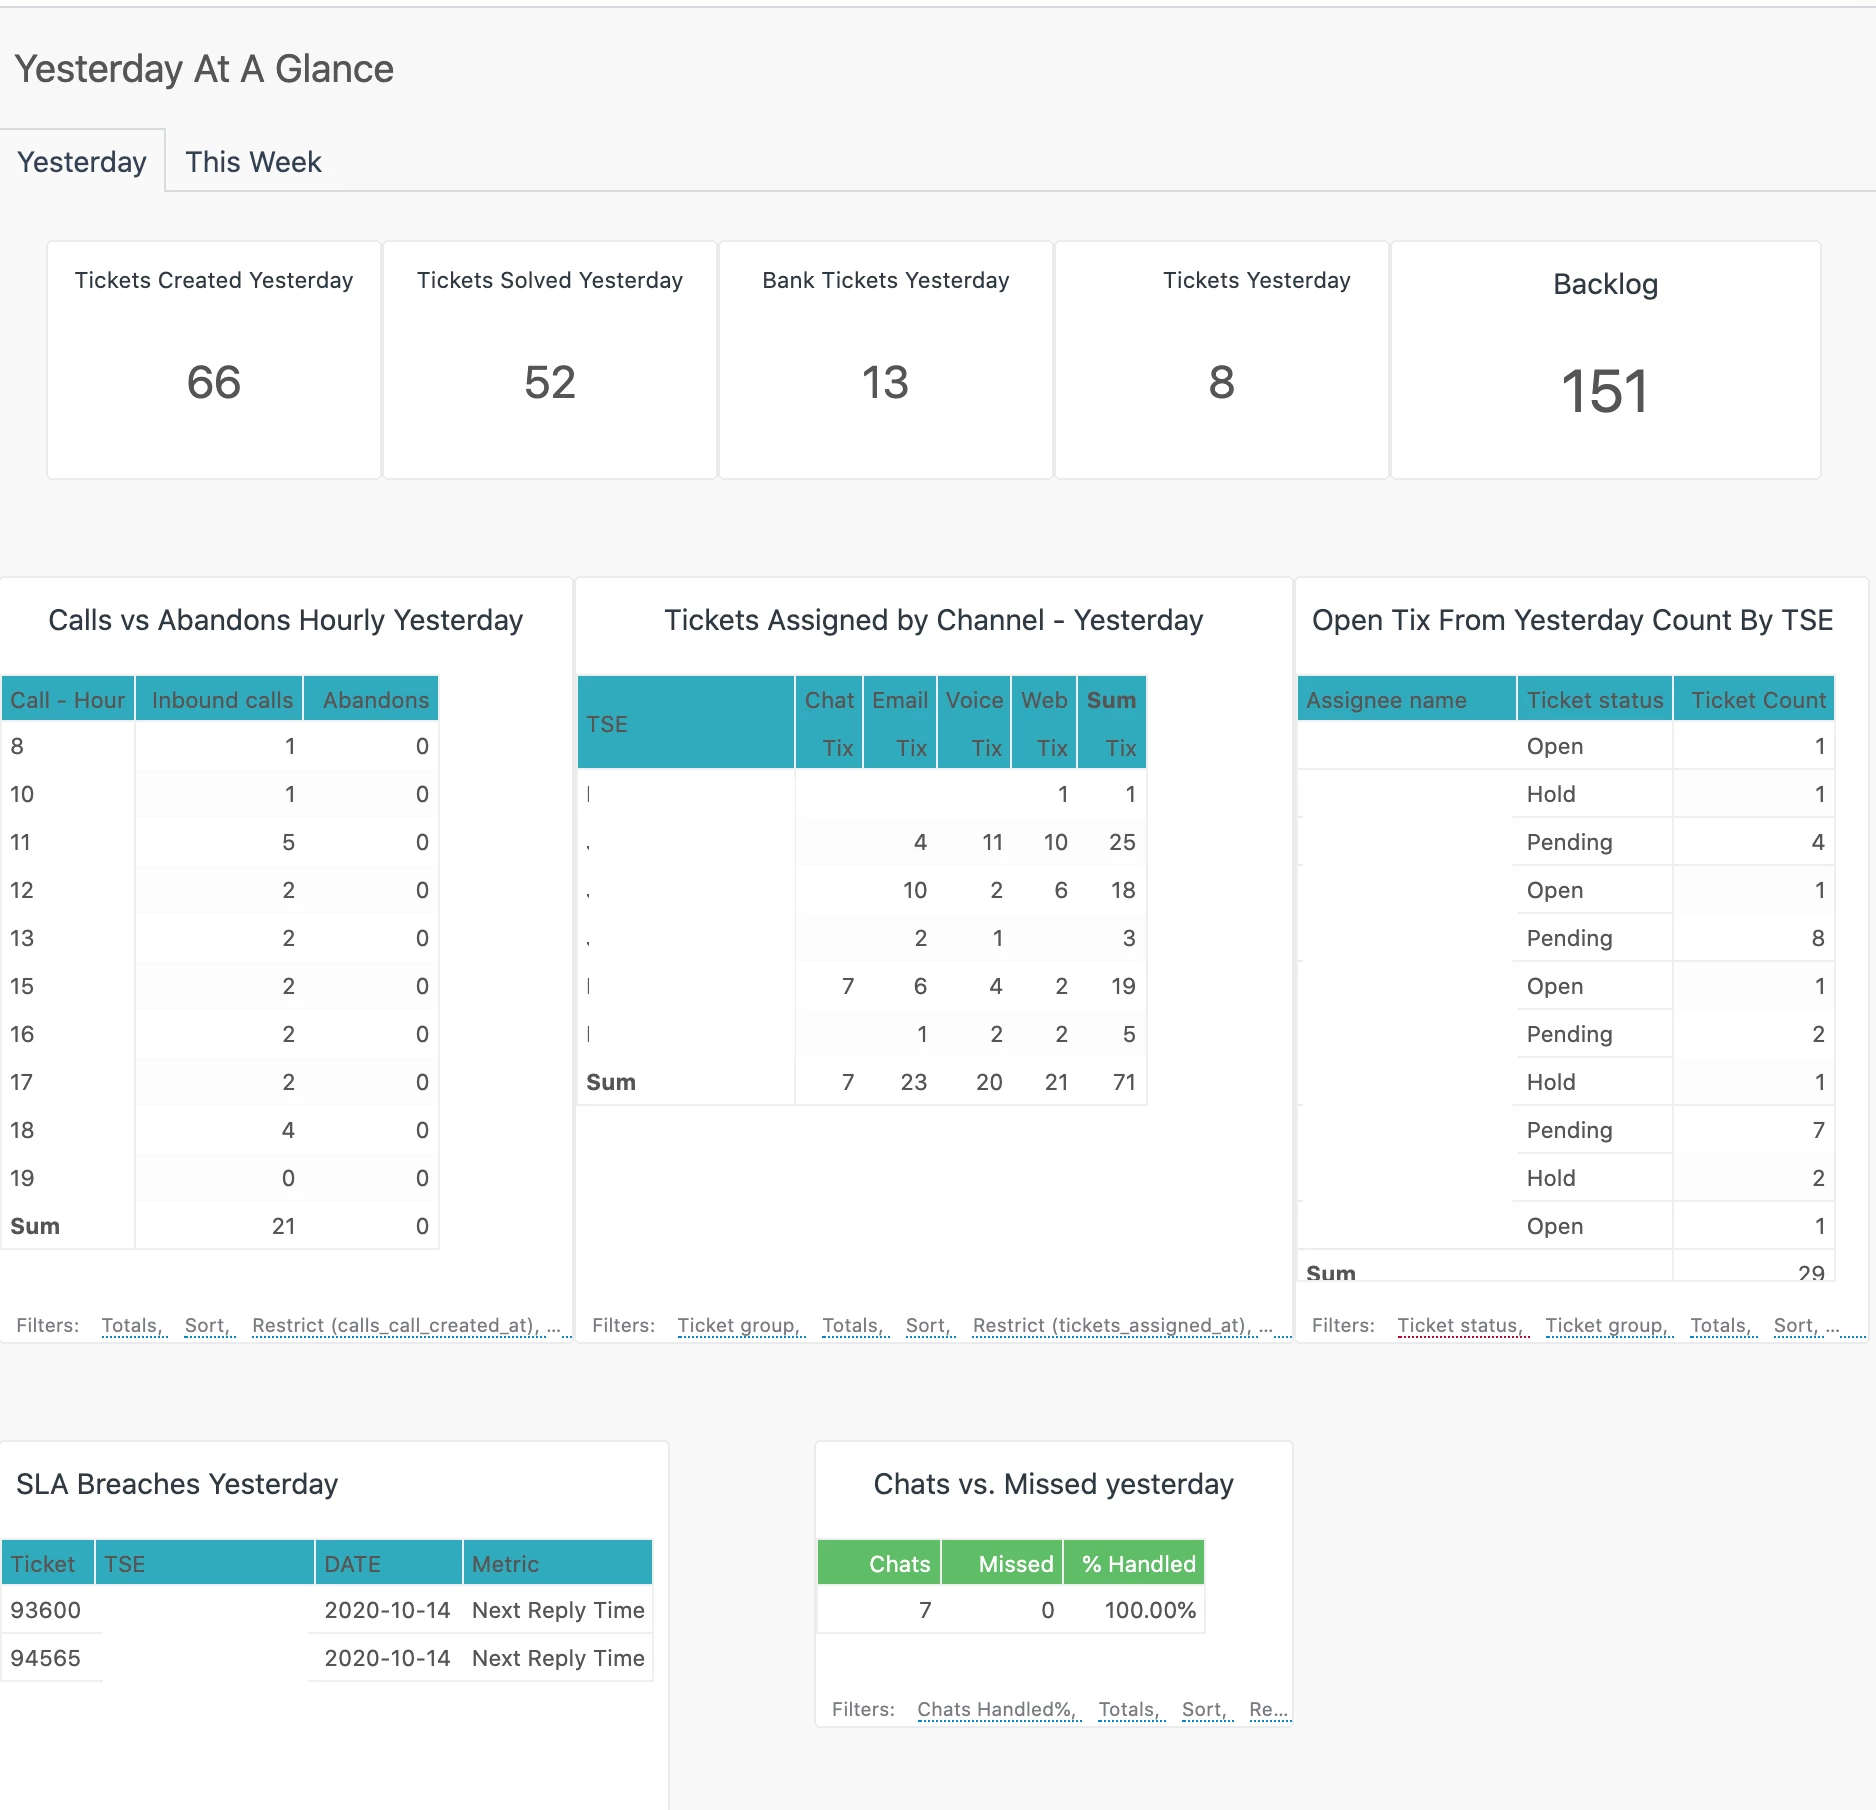
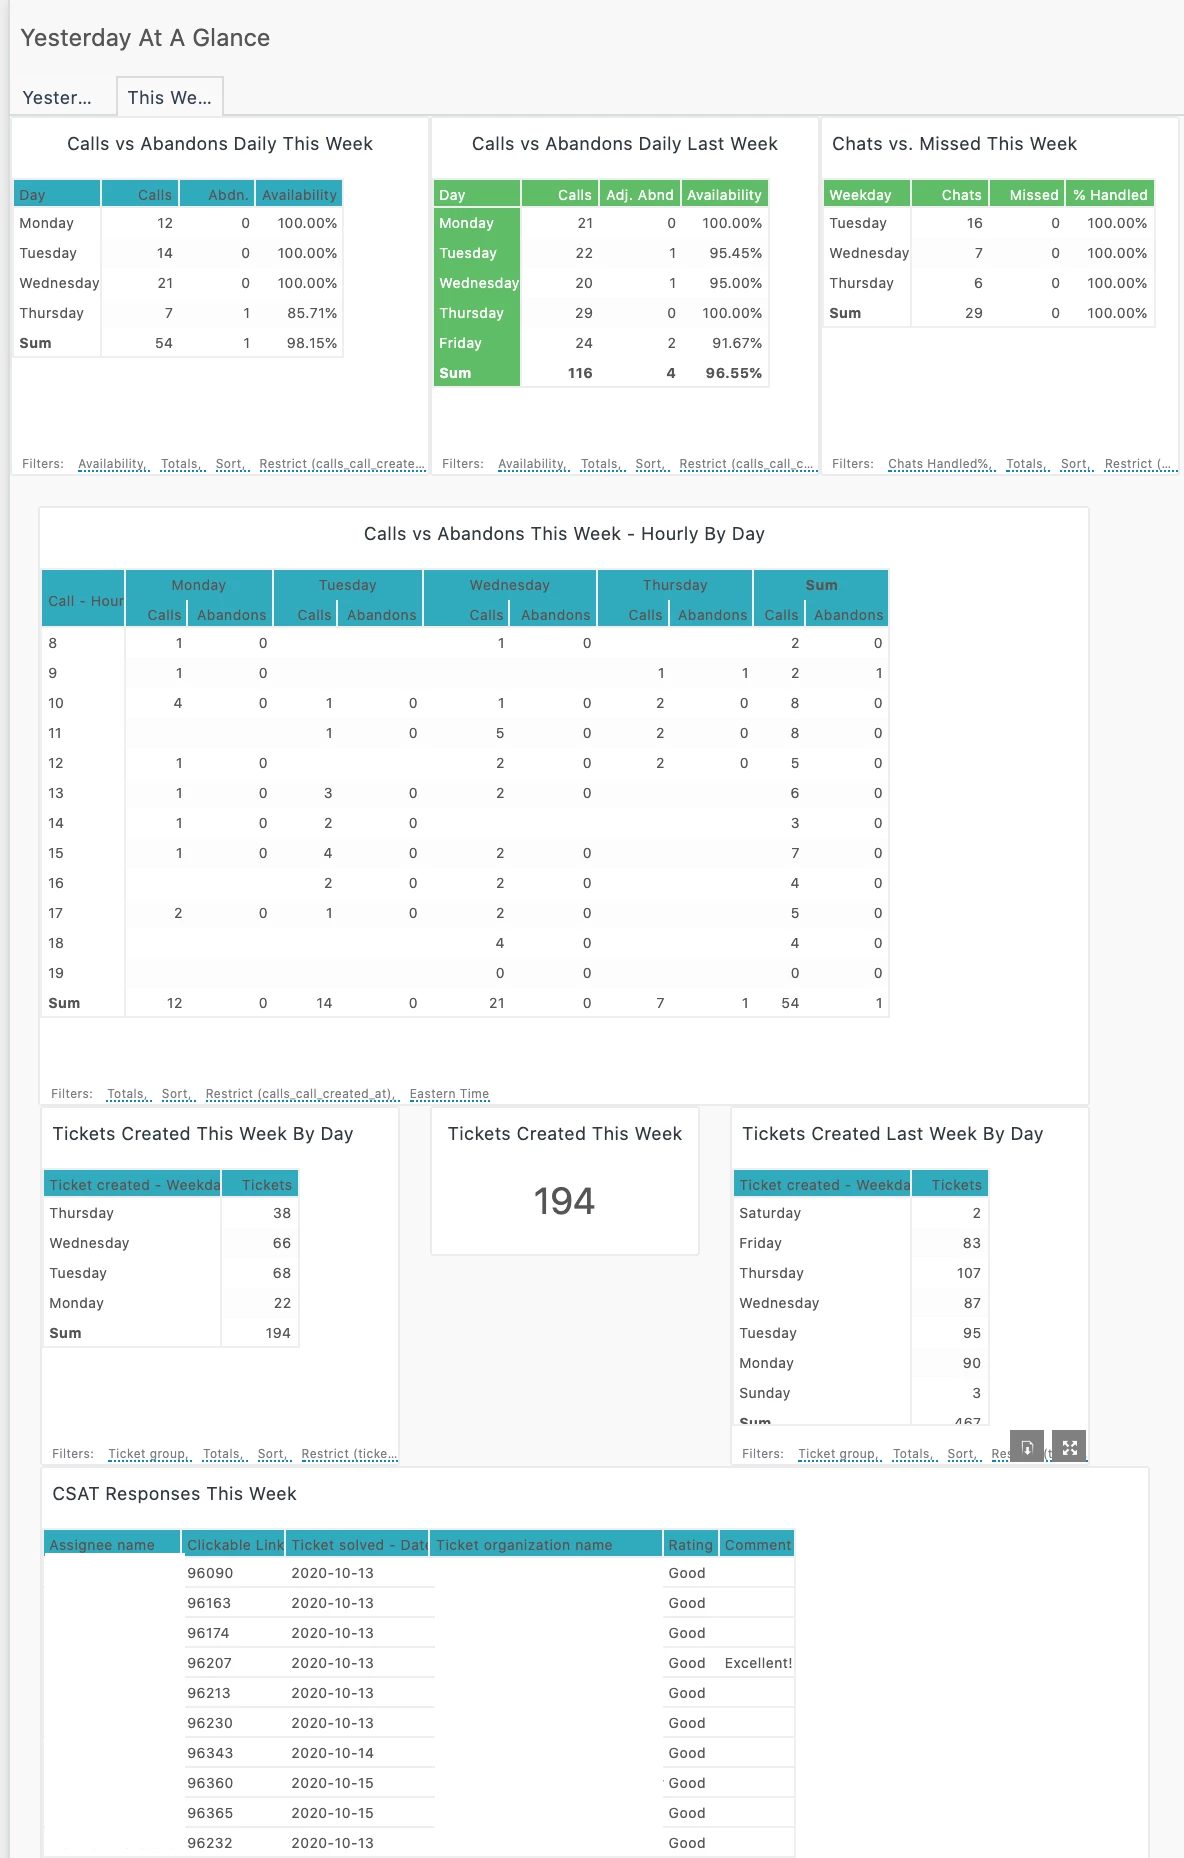
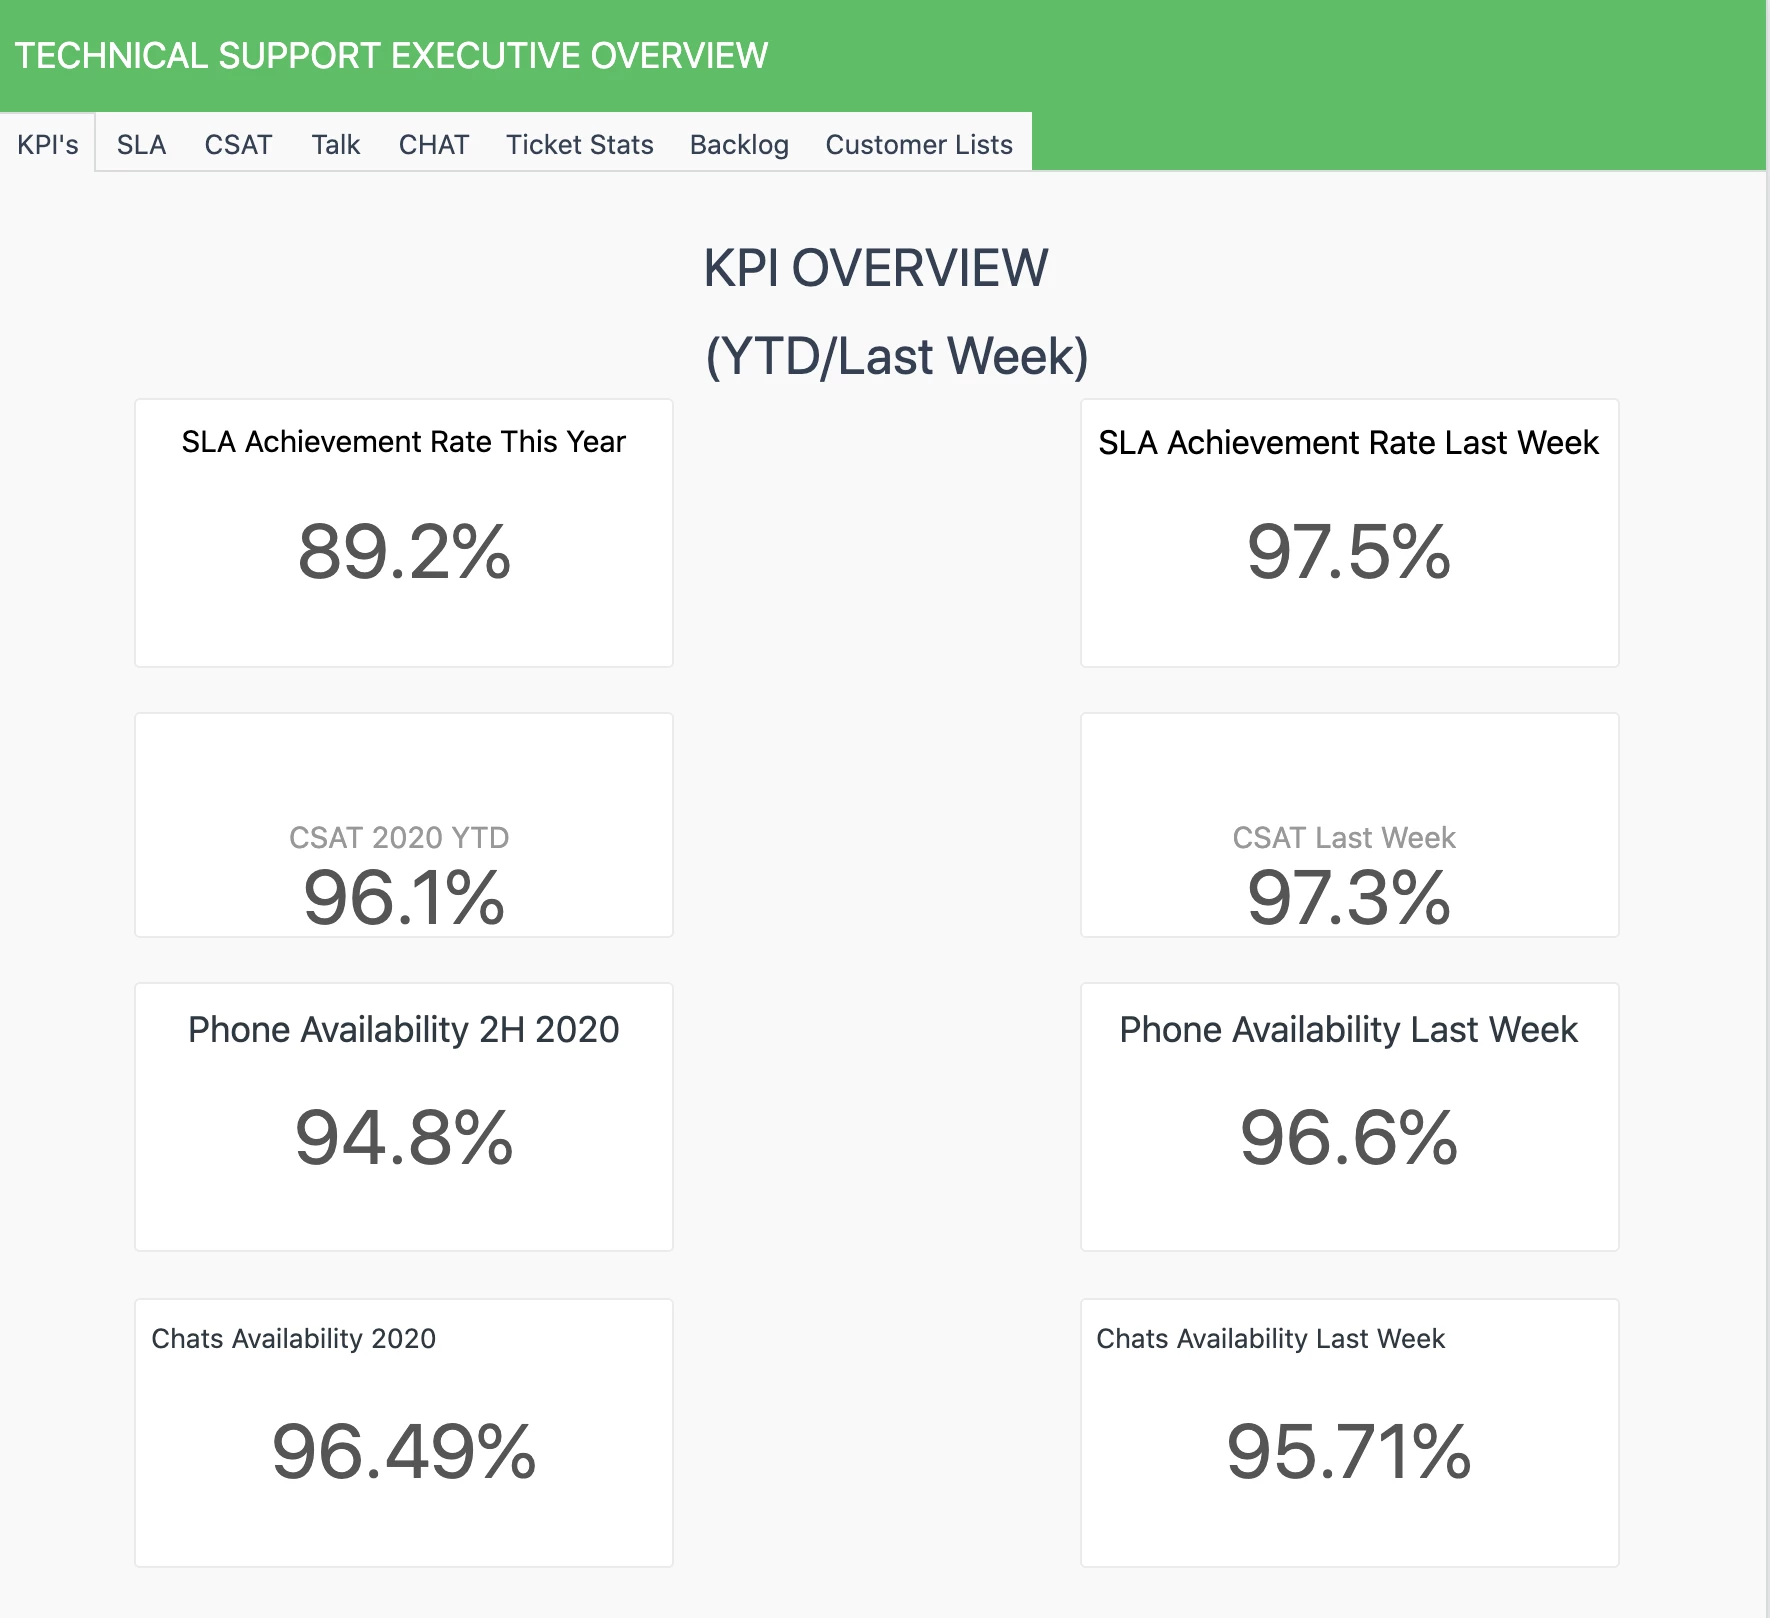
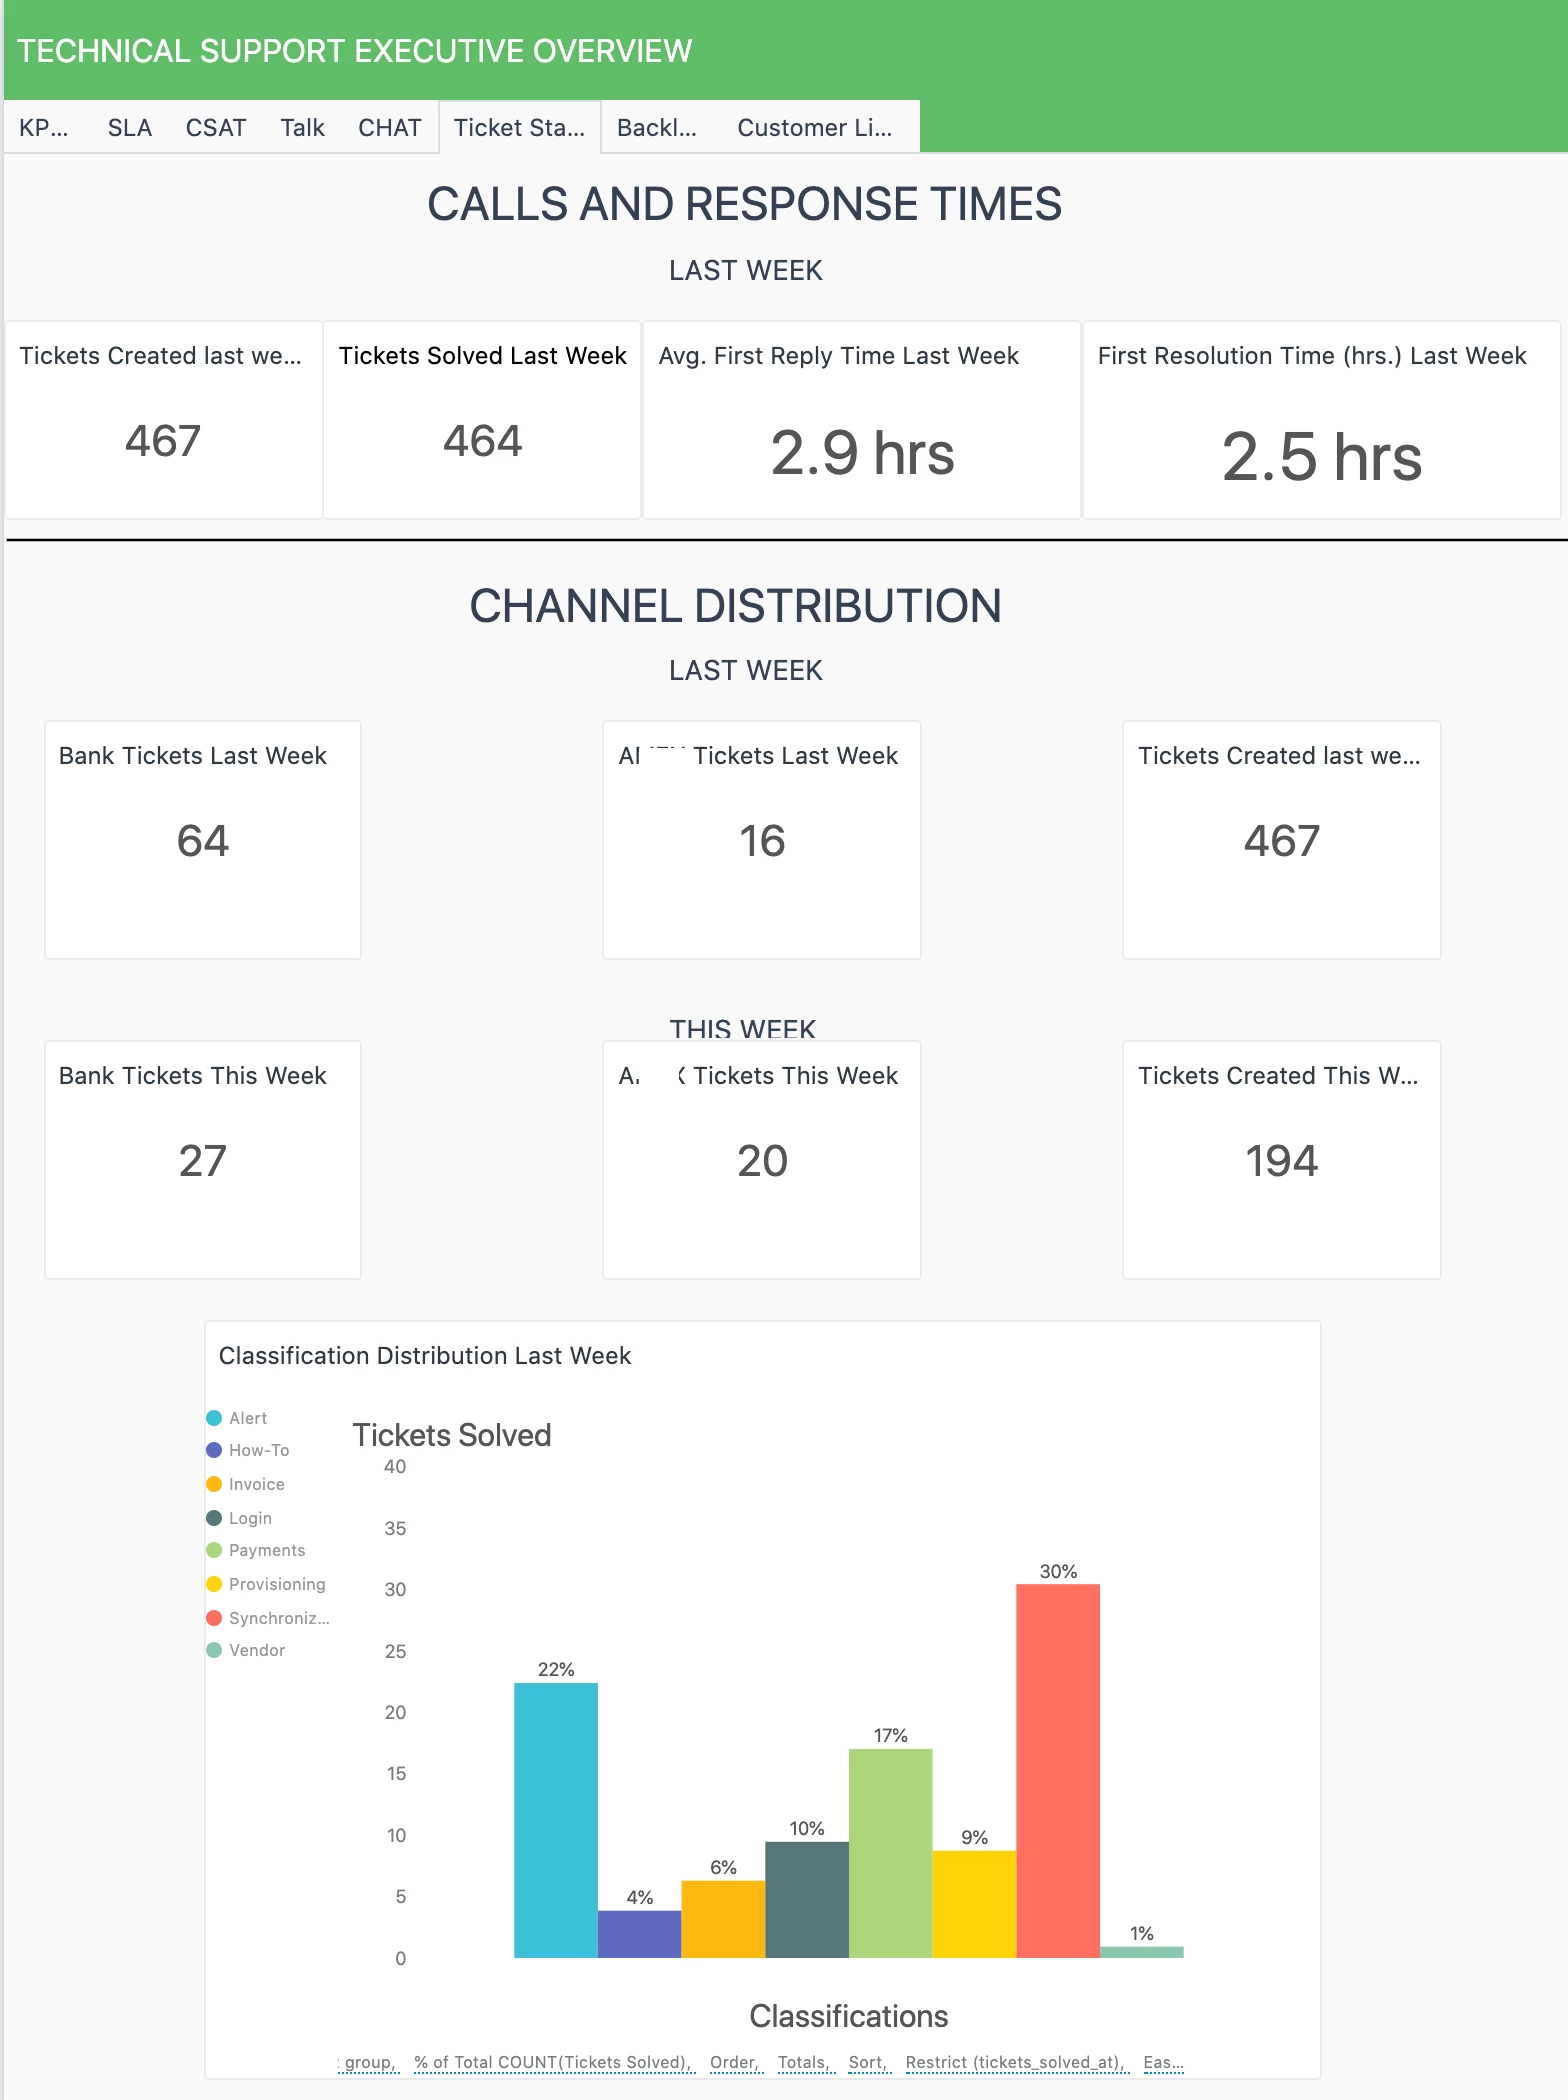
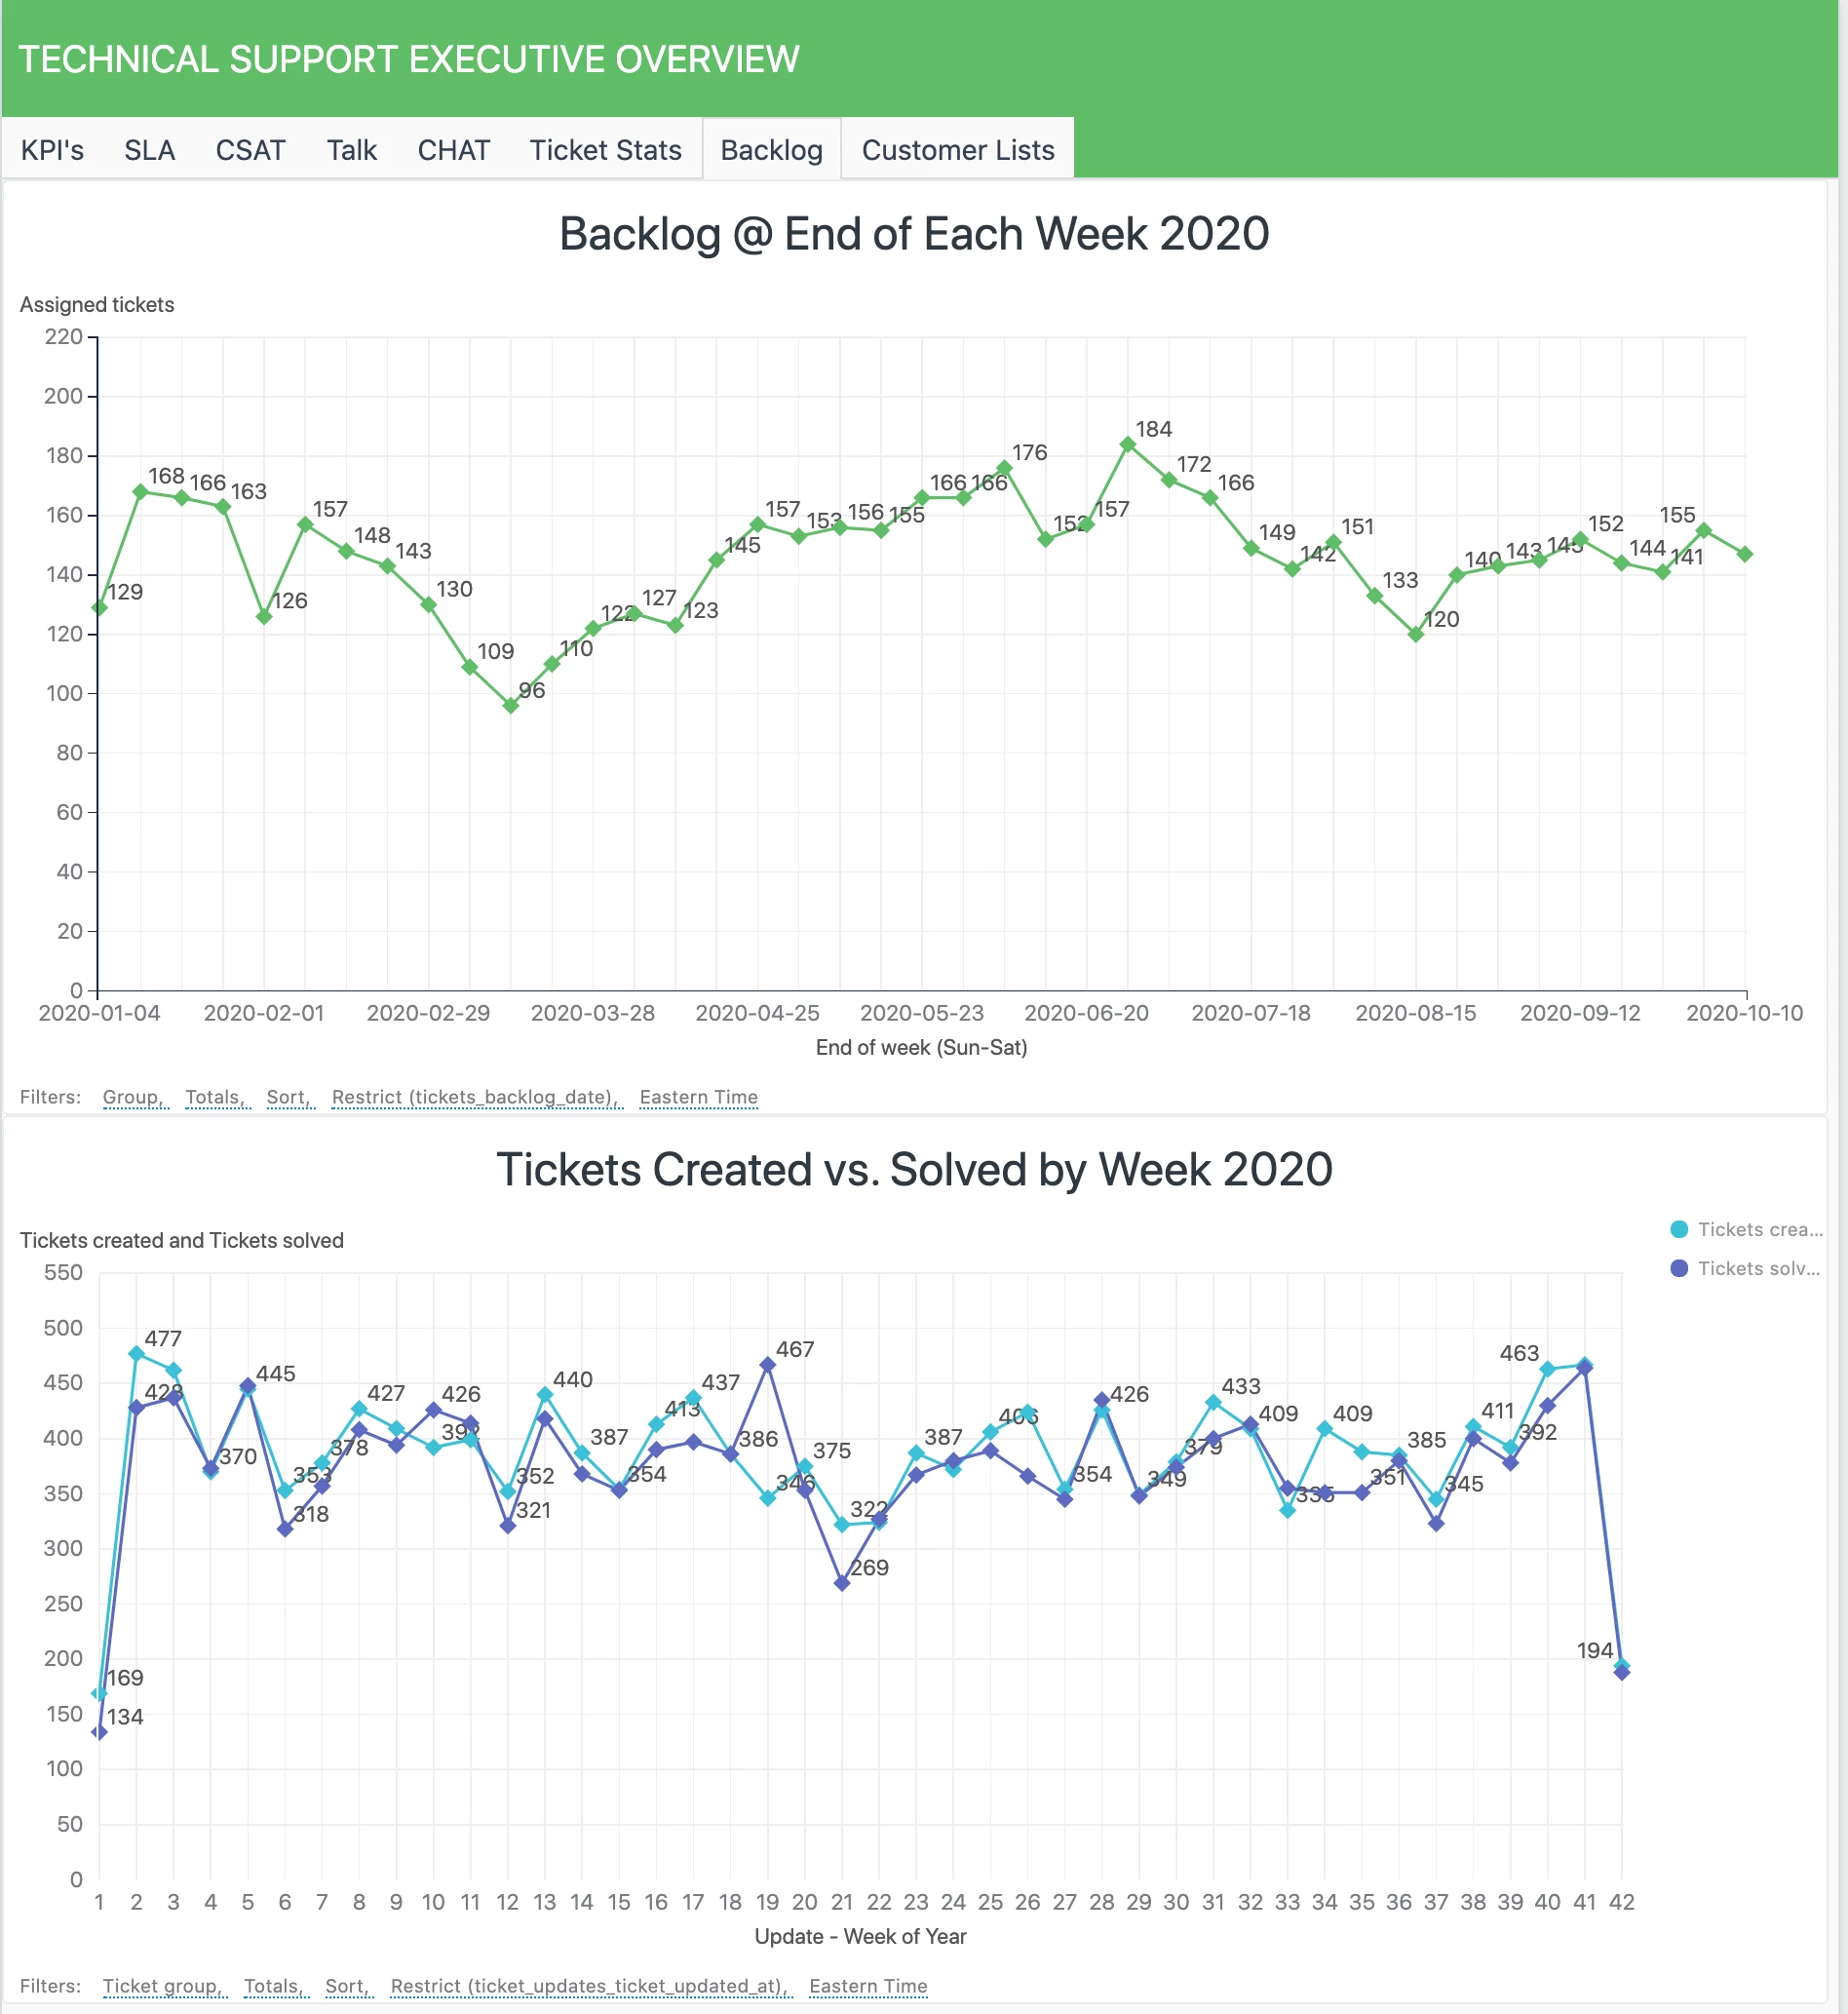
What does YOUR support dashboard in Explore look like?
Login to the community
No account yet? Create an account
Enter your E-mail address. We'll send you an e-mail with instructions to reset your password.
Thanks for sharing, Hillary!