Discrepancy between article views in Knowledge Base EAP in Explore and Reporting tab in Support | Community
Skip to main content

Discrepancy between article views in Knowledge Base EAP in Explore and Reporting tab in Support

  • January 5, 2021
  • 3 replies
  • 0 views

I was under the impression that the Knowledge Base EAP was supposed to report the same data as the Reporting tab in Support. However, when I look at the article views for the same time period I see a significant difference:

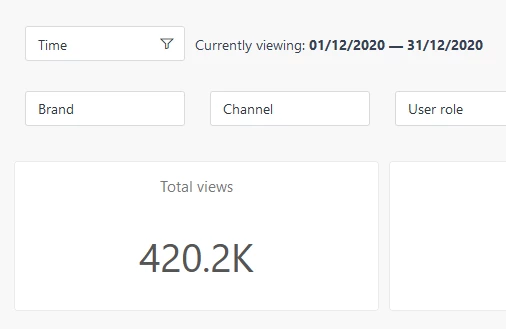
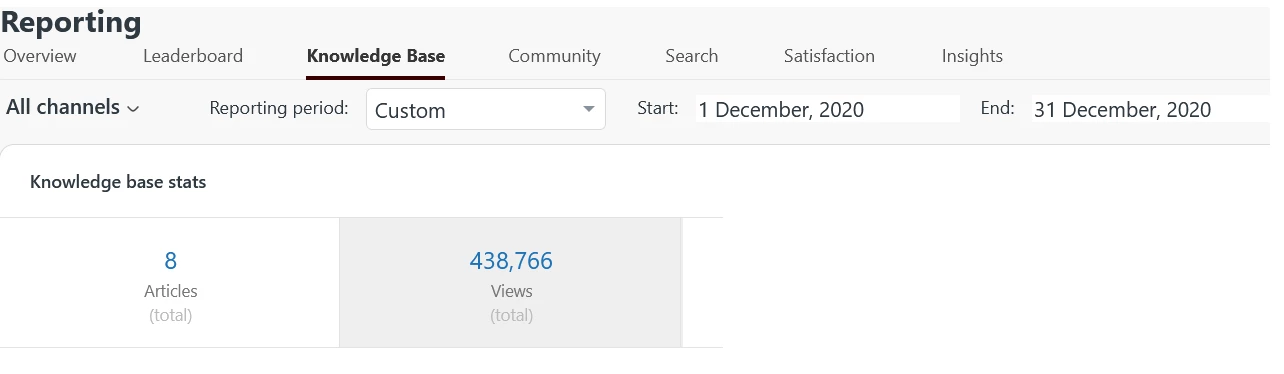
I didn't apply any filters to either of the reports. Are there any filters in the background (e.g., bot traffic)? Or what else could be an explanation for this discrepancy?

3 replies

  • January 6, 2021

Hi @Jessica Strozyk

Thanks for sharing this confusion, and we'll try to communicate this better for the future.

The situation is that it is quite tricky to record page views and thus, we invested in modernizing this for the Explore reporting capabilities. This means, that the data in Support and in the Explore reports originate from different data sources, and we cannot guarantee that the absolute numbers match, unfortunately. 

In this transition period, our recommendation is that you rely on comparing overall trends between the Support and Explore reports. Reliability is top of mind for us, so we've been carefully checking that our new Explore report is showing accurate page view numbers.  

If you're using other tool (like Google Analytics), then the story is the same. The page views are recorded in different ways, and absolute numbers will not match exactly. Thus, be careful when comparing the data and rely on overall trends. If something is drastically different, then please do reach out to us and we're happy to assist. 

Hope this is helpful. Thanks a lot again for raising this!


  • January 6, 2021

Hi Monika,

Our team is seeing accurate results in the Explore Knowledge Base EAP dashboard based on comparisons with other data tools. Hats off to everyone over at Zendesk that's working on this EAP.

Deep dives into data is the norm here, so for my own knowledge, I was hoping you could speak to the technical details of how page views are calculated in different ways compared to Google Analytics.

Thanks!

If you're using other tool (like Google Analytics), then the story is the same. The page views are recorded in different ways, and absolute numbers will not match exactly. Thus, be careful when comparing the data and rely on overall trends. If something is drastically different, then please do reach out to us and we're happy to assist. 


  • Author
  • January 6, 2021

Hi @Monika Kovacic,

I second Michael's request to learn more about how page views are measured.

We are using Mapp as a web tracking tool where we filter out bot and internal traffic and still see more page views than in Explore. To get you an impression of the size of the discrepancies, here the data for our most visited article for December:

Support: 17458

Mapp: 15425 (because of the mentioned filters, I would expect this number to be lower than for the Support Reporting)

Explore: 13714

That being said, the pattern of results is still similar. The top 10 articles are the same, albeit in a slightly different order.