Hi
I made one dashboard to monitor hourly chat volume and every 15mins chat volume of today, but the chart's X axis did not show latest time.
Please see below picture.
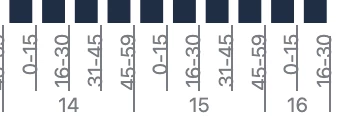
Now it's BJ time 17:30, and the chart only show the data till 16:30

Hi
I made one dashboard to monitor hourly chat volume and every 15mins chat volume of today, but the chart's X axis did not show latest time.
Please see below picture.
Now it's BJ time 17:30, and the chart only show the data till 16:30
No account yet? Create an account
Enter your E-mail address. We'll send you an e-mail with instructions to reset your password.
Hi Qin,
Data from your account (Support, Chat, Talk, and Guide) syncs to Explore at least an hour after the last sync. This is why you won't always see the latest data when viewing reports in Explore. In your example, it's likely that the last data sync happened at around 16:30, so the next sync will be happen between more or less 17:30 and 18:30. You can refer to this page for more info: How frequently does my Zendesk data sync to Explore?
Thank you, Qin!