Looking for ideas on creating reports for sub categories | Community
Skip to main content

Looking for ideas on creating reports for sub categories

  • July 6, 2023
  • 7 replies
  • 0 views

Joe12

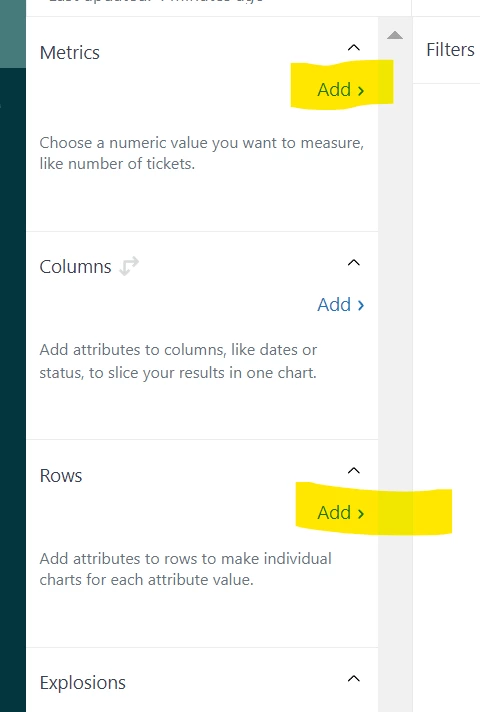
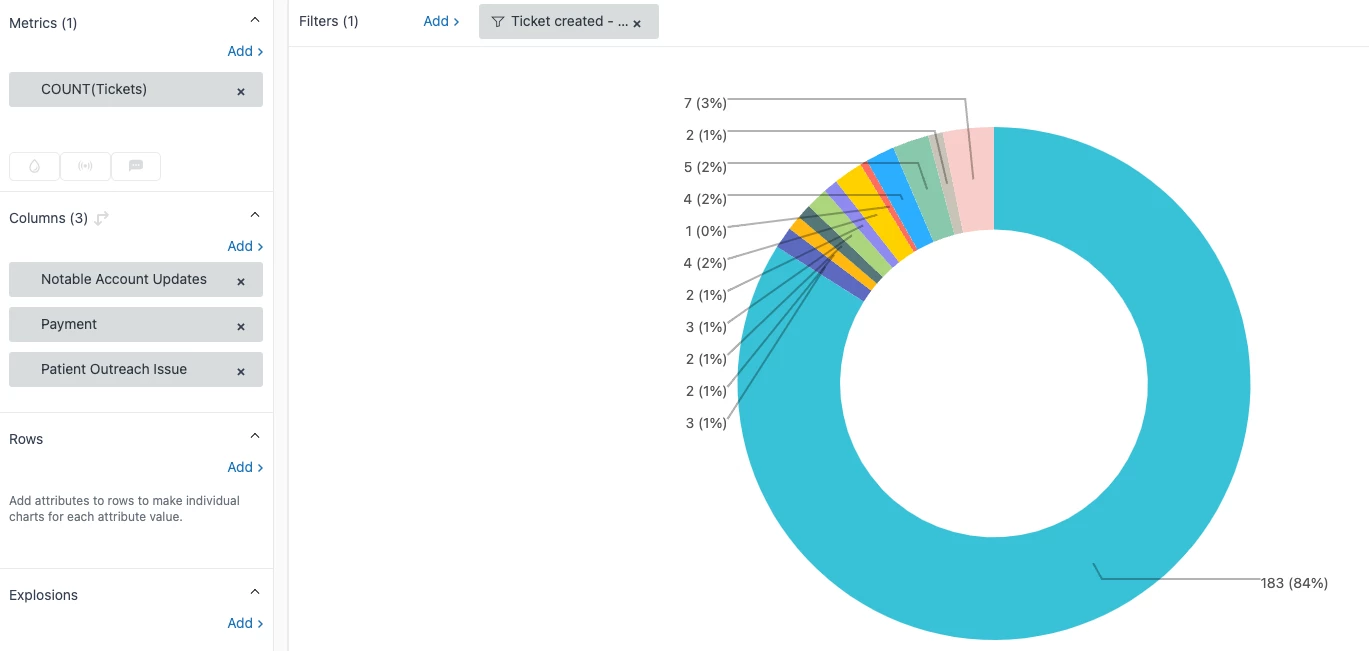
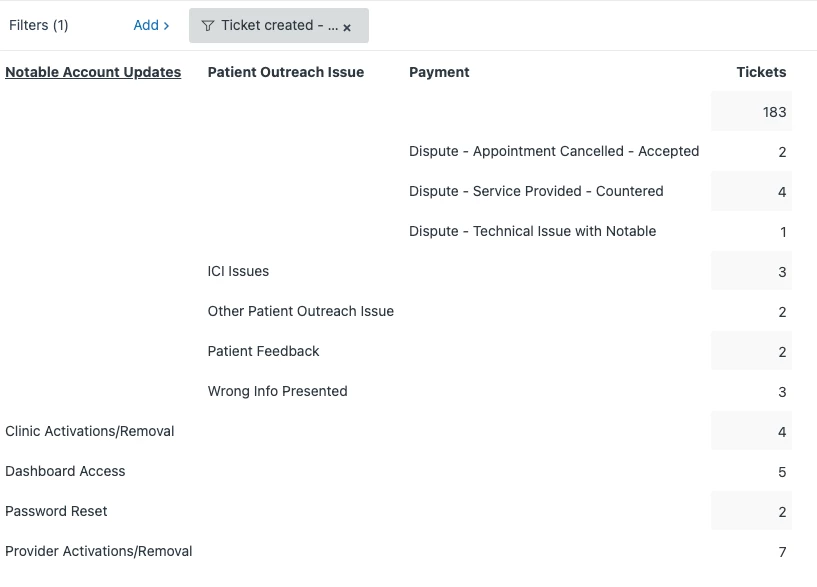
With Zendesk, it appears that the only way you can have sub categories that map to the corresponding category is to create a separate field for each sub category and then use the rules to create the dependancies. I.e. if you select "Admin issue" from the category list then it will display the dependent sub category list. This works great for working tickets but my question is on reporting on sub categories. How can I build a report that pulls a list of all tickets broken down by sub categories? Has anyone else experienced this and if so, what are you doing to report on this? 

7 replies

Jahn11
  • July 7, 2023

Hi Joe Huisman - the way I understand your concern you just want to pretty much get a reporting in explore that will pull data for Sub-Categories? 

There are 2 questions I have.
1. Do you have separate ticket fields for Sub-Categories which is conditional whenever you selected Category type? 
2. or, are you using "::" for your category as a selection which is under 1 ticket field only? 

Both are available by the way under Explore attributes field. 


Joe12
  • Author
  • July 10, 2023

The answer is #1. I didn't see any other way to do sub categories that are dependent on the category selection. 
So sub categories is broken down into several fields with a list for each field and the fields are dependent on the selection of the category. 

I would ultimately like to pull a report that shows the number of tickets associated with each sub category list item but there doesn't seem to be a way to do that. 
Let me know if I am still not making sense. This is a little tricky to explain in text. 


Jahn11
  • July 11, 2023

Hi Joe Huisman - if that's  the case then you can get those ticket report in Explore by typing in the attributes field name in Explore report of the Sub Category field. 

Then ticket in the metric section. 


Joe12
  • Author
  • July 11, 2023

Thanks. I have tried that though and the challenge is that since there are multiple fields that I want to report on in the same report, they don't display in a way that is useful. For example, if I do a table, I get multiple columns. If I try to do a pie chart, then it is not displaying correctly.


Jahn11
  • July 13, 2023

Hi Joe Huisman - you might as well drag those attributes from columns into rows below then your report will be more clear and neat.


Joe12
  • Author
  • July 13, 2023

Not sure what you are suggesting. The Table screenshot has them in the Rows section. If I change that to a pie chart, it just makes a target of rings rather than a pie chart. Ultimately I think this is due to the way sub categories is set up but I don't know a different way to do this with ZD. 


  • July 14, 2023
Hi Joe, 
 
I created a ticket on your behalf and will send it to you via email so we can discuss your use-case. 
 
Thank you!