
The Goal
It can be really satisfying (ha) to see all of your CSAT ratings with clear visual indicators for good and bad CSAT in the Reporting section of your instance. As Insights will be removed in February 2021, I thought I would share how we recreated this experience using Explore.
Prerequisites
- Zendesk Explore Professional
- Image links for the indicator you would like to use
Explore doesn't have a way to highlight the rating name as green or red, but you can add a URL to an image and use that to make it easy to visually identify good and bad ratings. In my case, I chose a green dot for good and a red dot for bad.
Instructions
Step 1
- Create a new Explore query using the Support: Tickets dataset
Step 2
- Add the metric COUNT(Rated Satisfaction tickets)
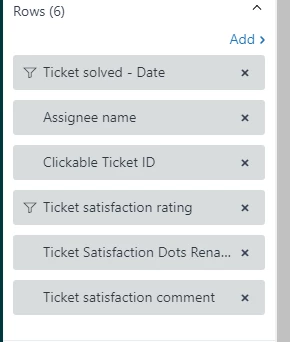
- Add the following attributes to Rows:
- Ticket solved - Date (filter: Edit date ranges>Advanced> 1 month in the past to today) You may need to adjust the date filter depending upon the number of rows generated. Reducing the timeframe should allow you to avoid reaching the row limit.
- Assignee Name
- Clickable Ticket ID
- Ticket Satisfaction (filter: Include Good, Bad)
- Ticket Satisfaction Comment
Step 3
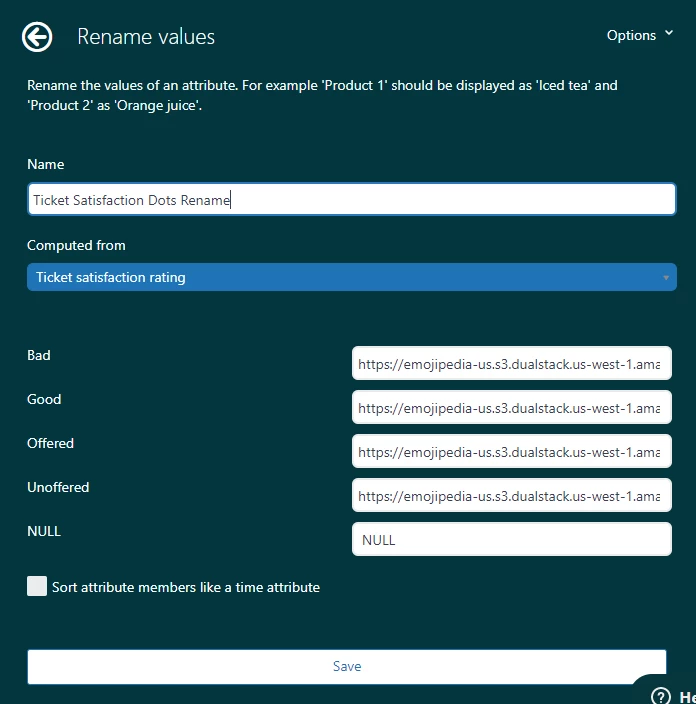
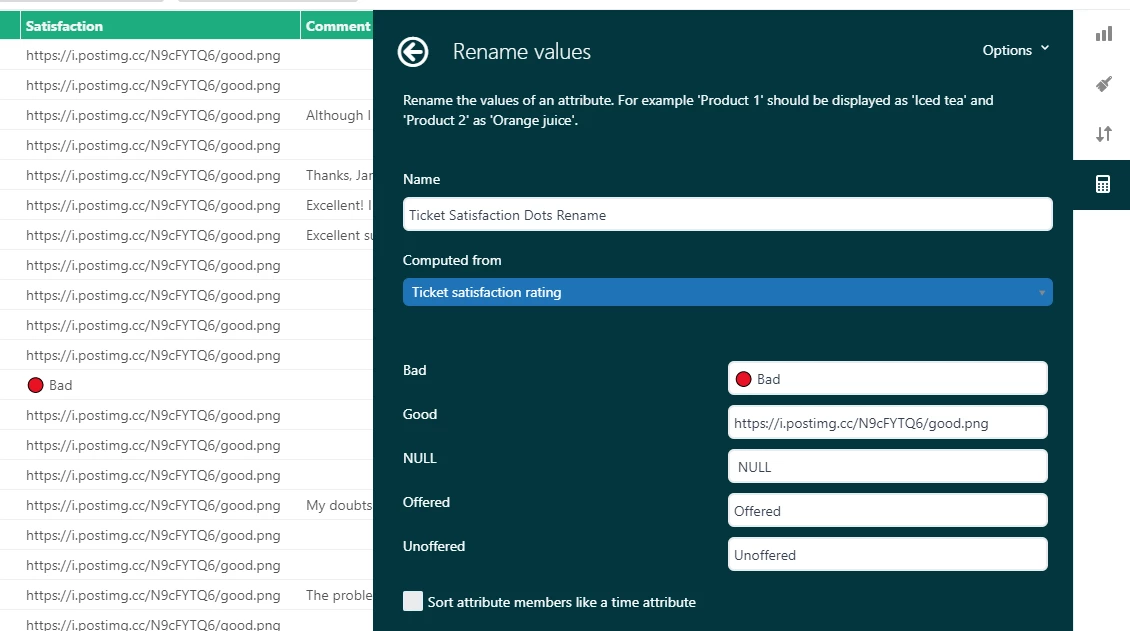
- Create a Renamed Set Attribute
- For this step you will need your image URLs
- Click on Calculations at the right
- Select "Renamed Set"
- Name your new attribute, I chose "Ticket Satisfaction Dots Rename"
- Set the "Computed From" to Ticket Satisfaction Rating
- For each condition add the URL for the image you would like to represent that attribute
- Save your changes
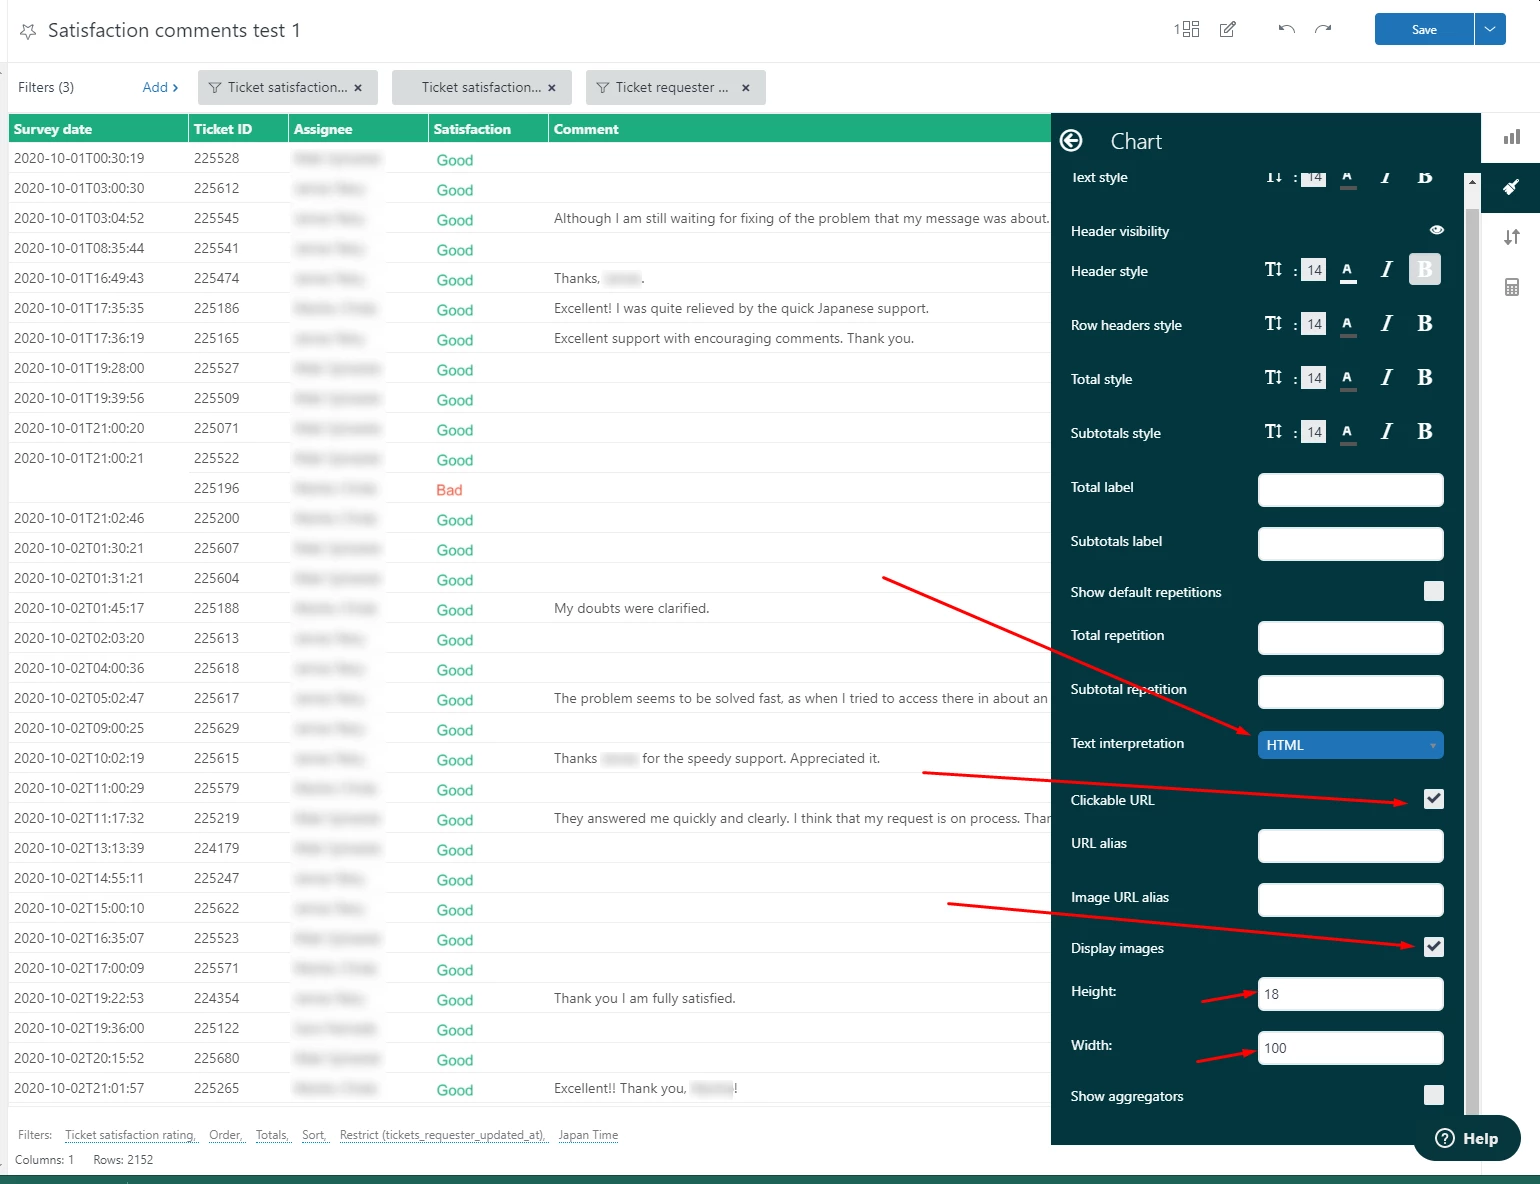
Step 5
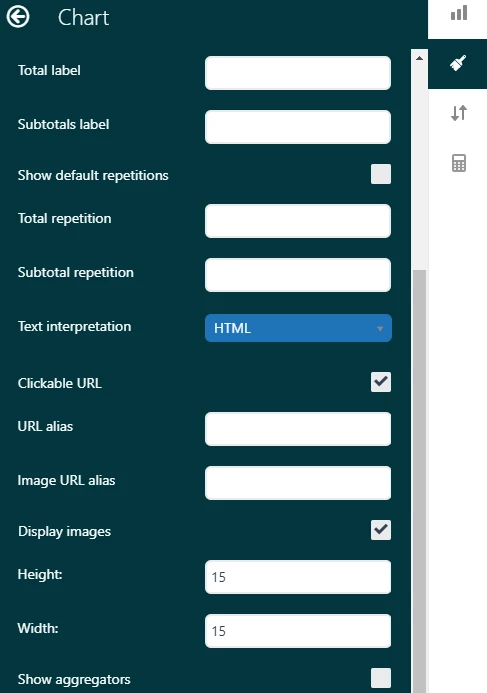
Now you'll need to configure your query to recognize the links we just added.
- Click on the Configuration paint brush icon on the right side
- Select Chart
- Change the "Text Interpretation" field to HTML
Once saved, you can now add this new attribute to your rows. Your attributes will look like this:
Step 5
- Apply any filters that make sense for your business model. For instance, we tag chat trolls so they can be excluded from our satisfaction comments.
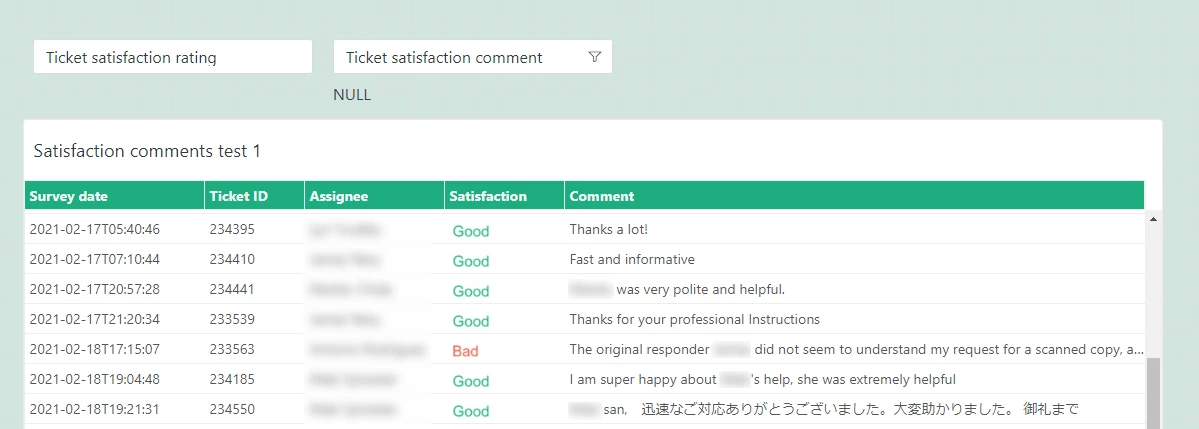
The Result
Your finished product will look similar to this:
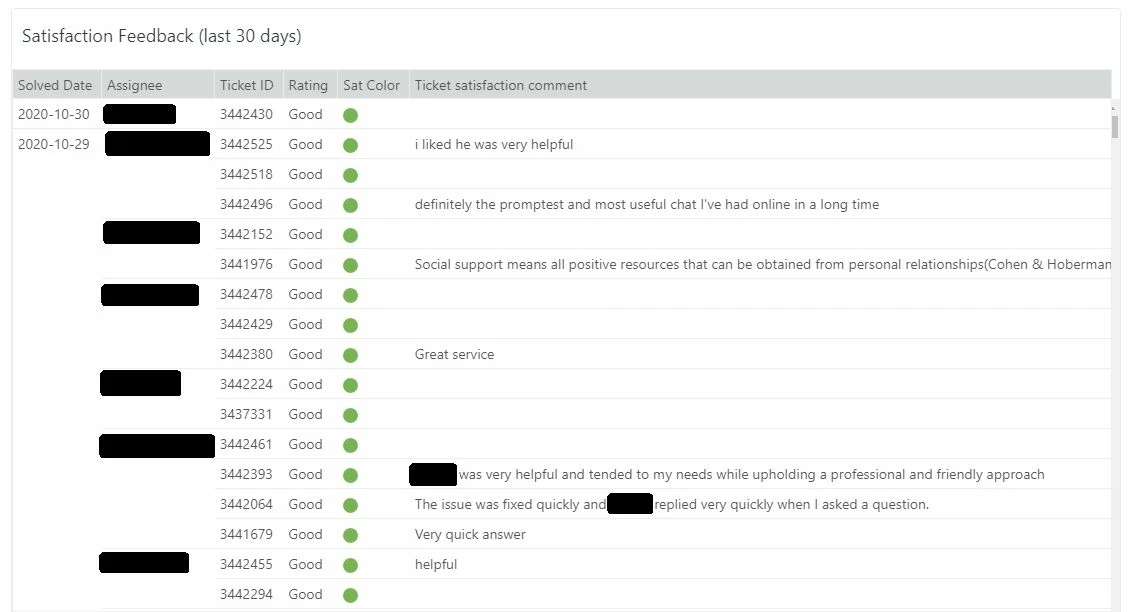
Now you can have a quick and easy view of your CSAT in Explore. Enjoy!


Currently, Zendesk Explore allows sorting only on columns that contain metric data by default. Unfortunately, sorting directly on attribute columns such as Ticket ID, Solved date, Assignee, or Satisfaction is not supported natively within the ready-made tables.
As a workaround, you might consider:
We understand that more flexible sorting options would enhance your reporting experience, and your feedback is valuable.