
Hello Team,
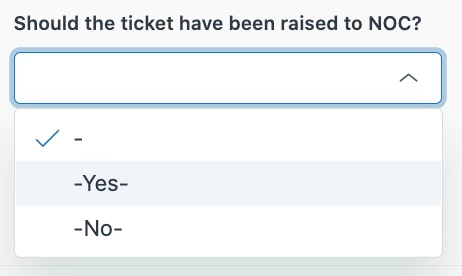
I have a custom field 2 separate answers, "-Yes-" and "-No-":
I'd like top create a Line chart or a stacked chart to report on both tags for each week of the year but when I create a calculated metric for each tag I can only seem to pull data for one at a time.
My metric calculations are as follows for the -no- Tag:
IF (INCLUDES_ANY([Ticket tags], "-no-")) THEN
    [Ticket ID]
ENDIF
For the -yes- Tag:
IF (INCLUDES_ANY([Ticket tags], "-yes-")) THEN
    [Ticket ID]
ENDIF
However for some reason it will only pull data for either one of the other depending on which one I create first like below:
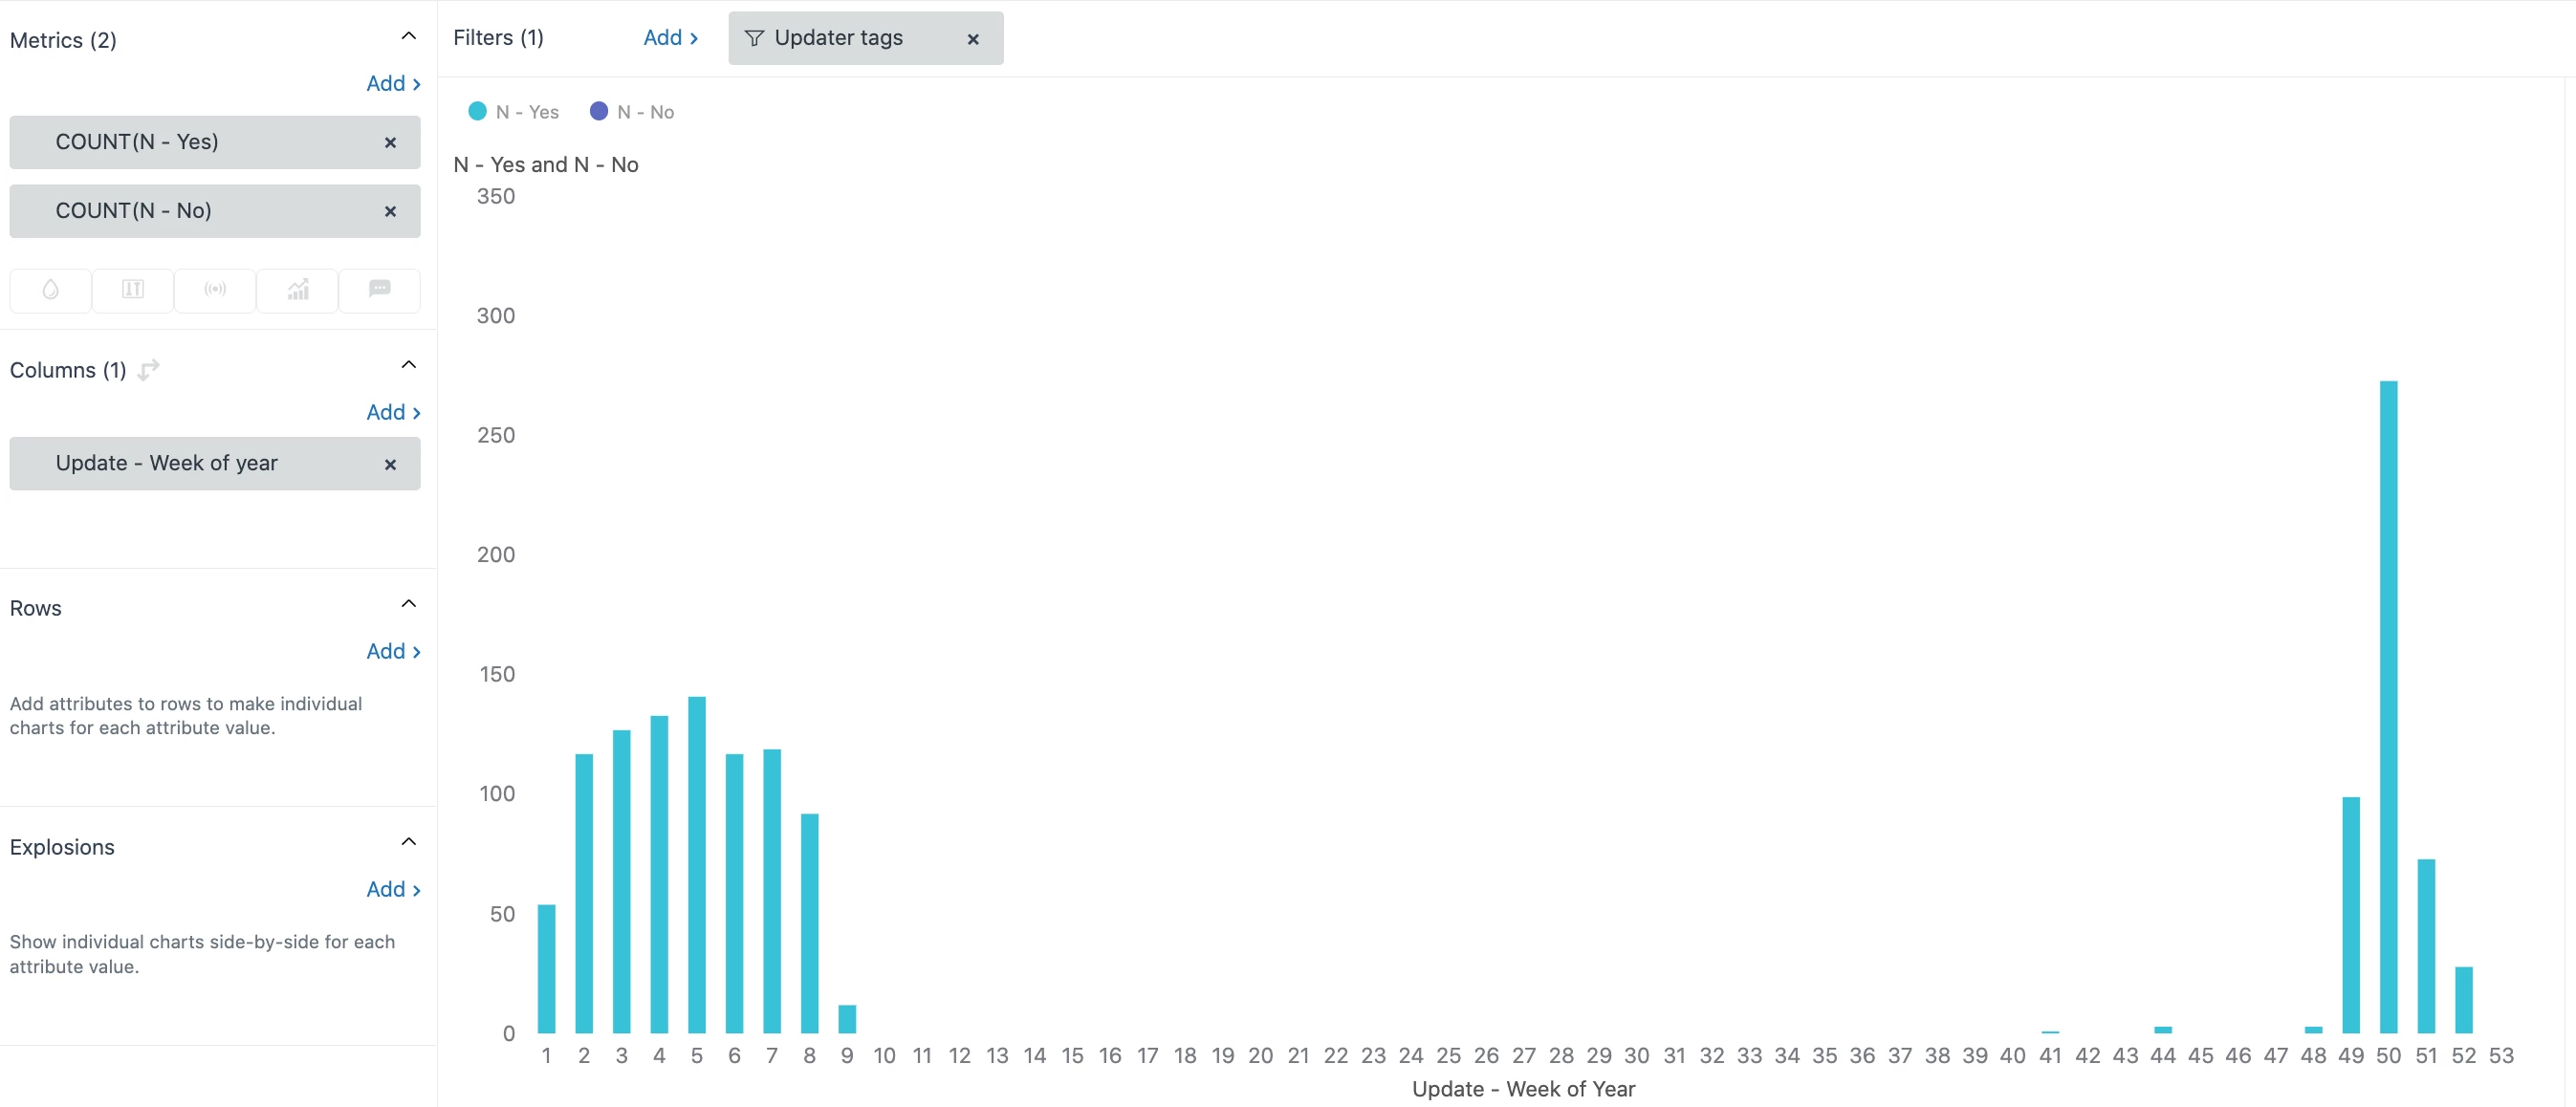
I've tried using count, D_Count and Sum and no luck.
Yet when I do a combined query such as:
IF (INCLUDES_ANY([Ticket tags], "-yes-", "-no-")) THEN
    [Ticket ID]
ENDIF
Then it will combine them into one Column but I want them measure as separate attributes.
It's been driving me crazy so any help appreciated.