Team Publishing data set: Calculated Metric for Verified Articles | Community
Skip to main content

Team Publishing data set: Calculated Metric for Verified Articles

  • March 31, 2021
  • 1 reply
  • 0 views

Ryan15

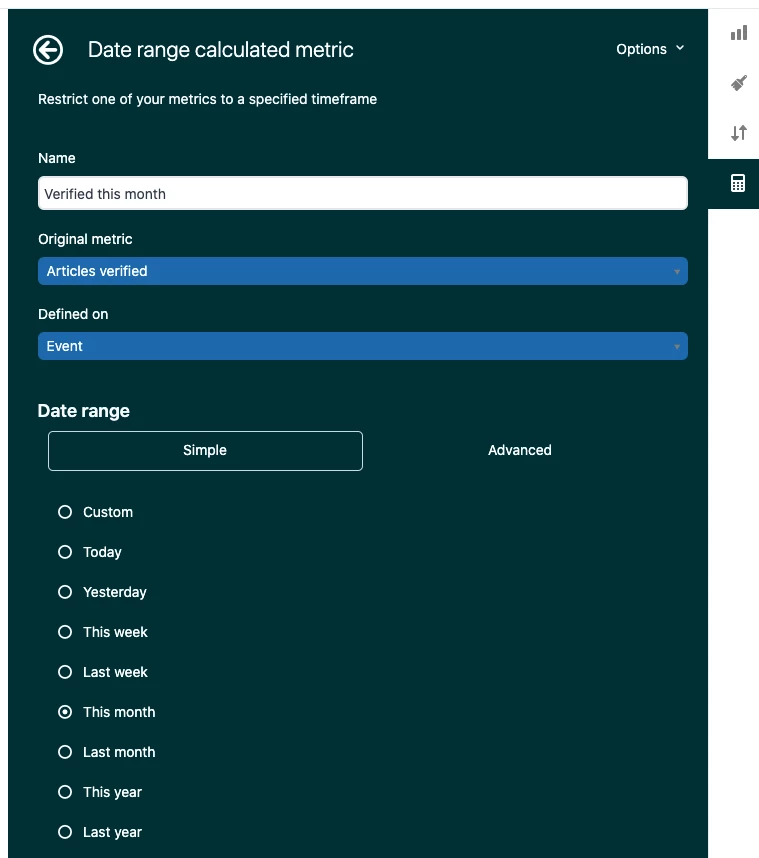
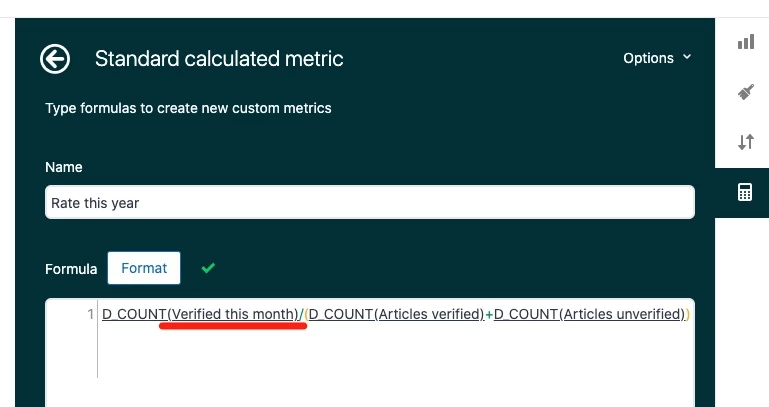
I am attempting to put together a metric for the number of verified and unverified articles in a given month (i.e., how many/what percentage of the unverified articles were verified over the past 30 days). I've created the following:

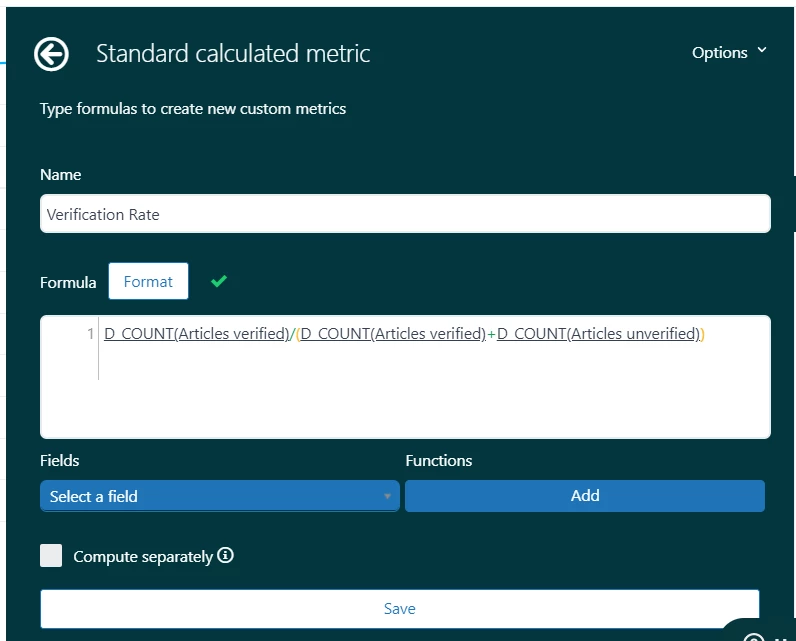
However, I don't think this is giving me the information I am looking for. What I believe this is showing is the number of articles that switched to "verified" status divided by the number of articles that switched to "verified" status plus the number of articles switched to "unverified" status. The problem is that this does not account for articles that switched to "unverified" status prior to 30 days ago and are still "unverified" this month. And because of this, it is not providing an accurate representation when I try to display this month to month. Any ideas/recommendations for calculating the right metric? Thanks!

1 reply

  • April 20, 2021

Hi Ryan,

If you're filtering the entire report by any event date attribute, then this would filter all the metrics involved in any calculation within the query. A workaround that I can suggest is to first create a date range calculated metric to get the number of articles verified this month –

– and then use that custom date range metric in your original metric instead.


This way, you don't have to use a query-level filter, and the total count – ((D_COUNT(Articles verified)+D_COUNT(Articles unverified)) – of verified/unverified articles in your calculation won't be filtered by date.

Hope this helps. Thanks Ryan!

Gab