Hello ZD Community,
I hope you are well.
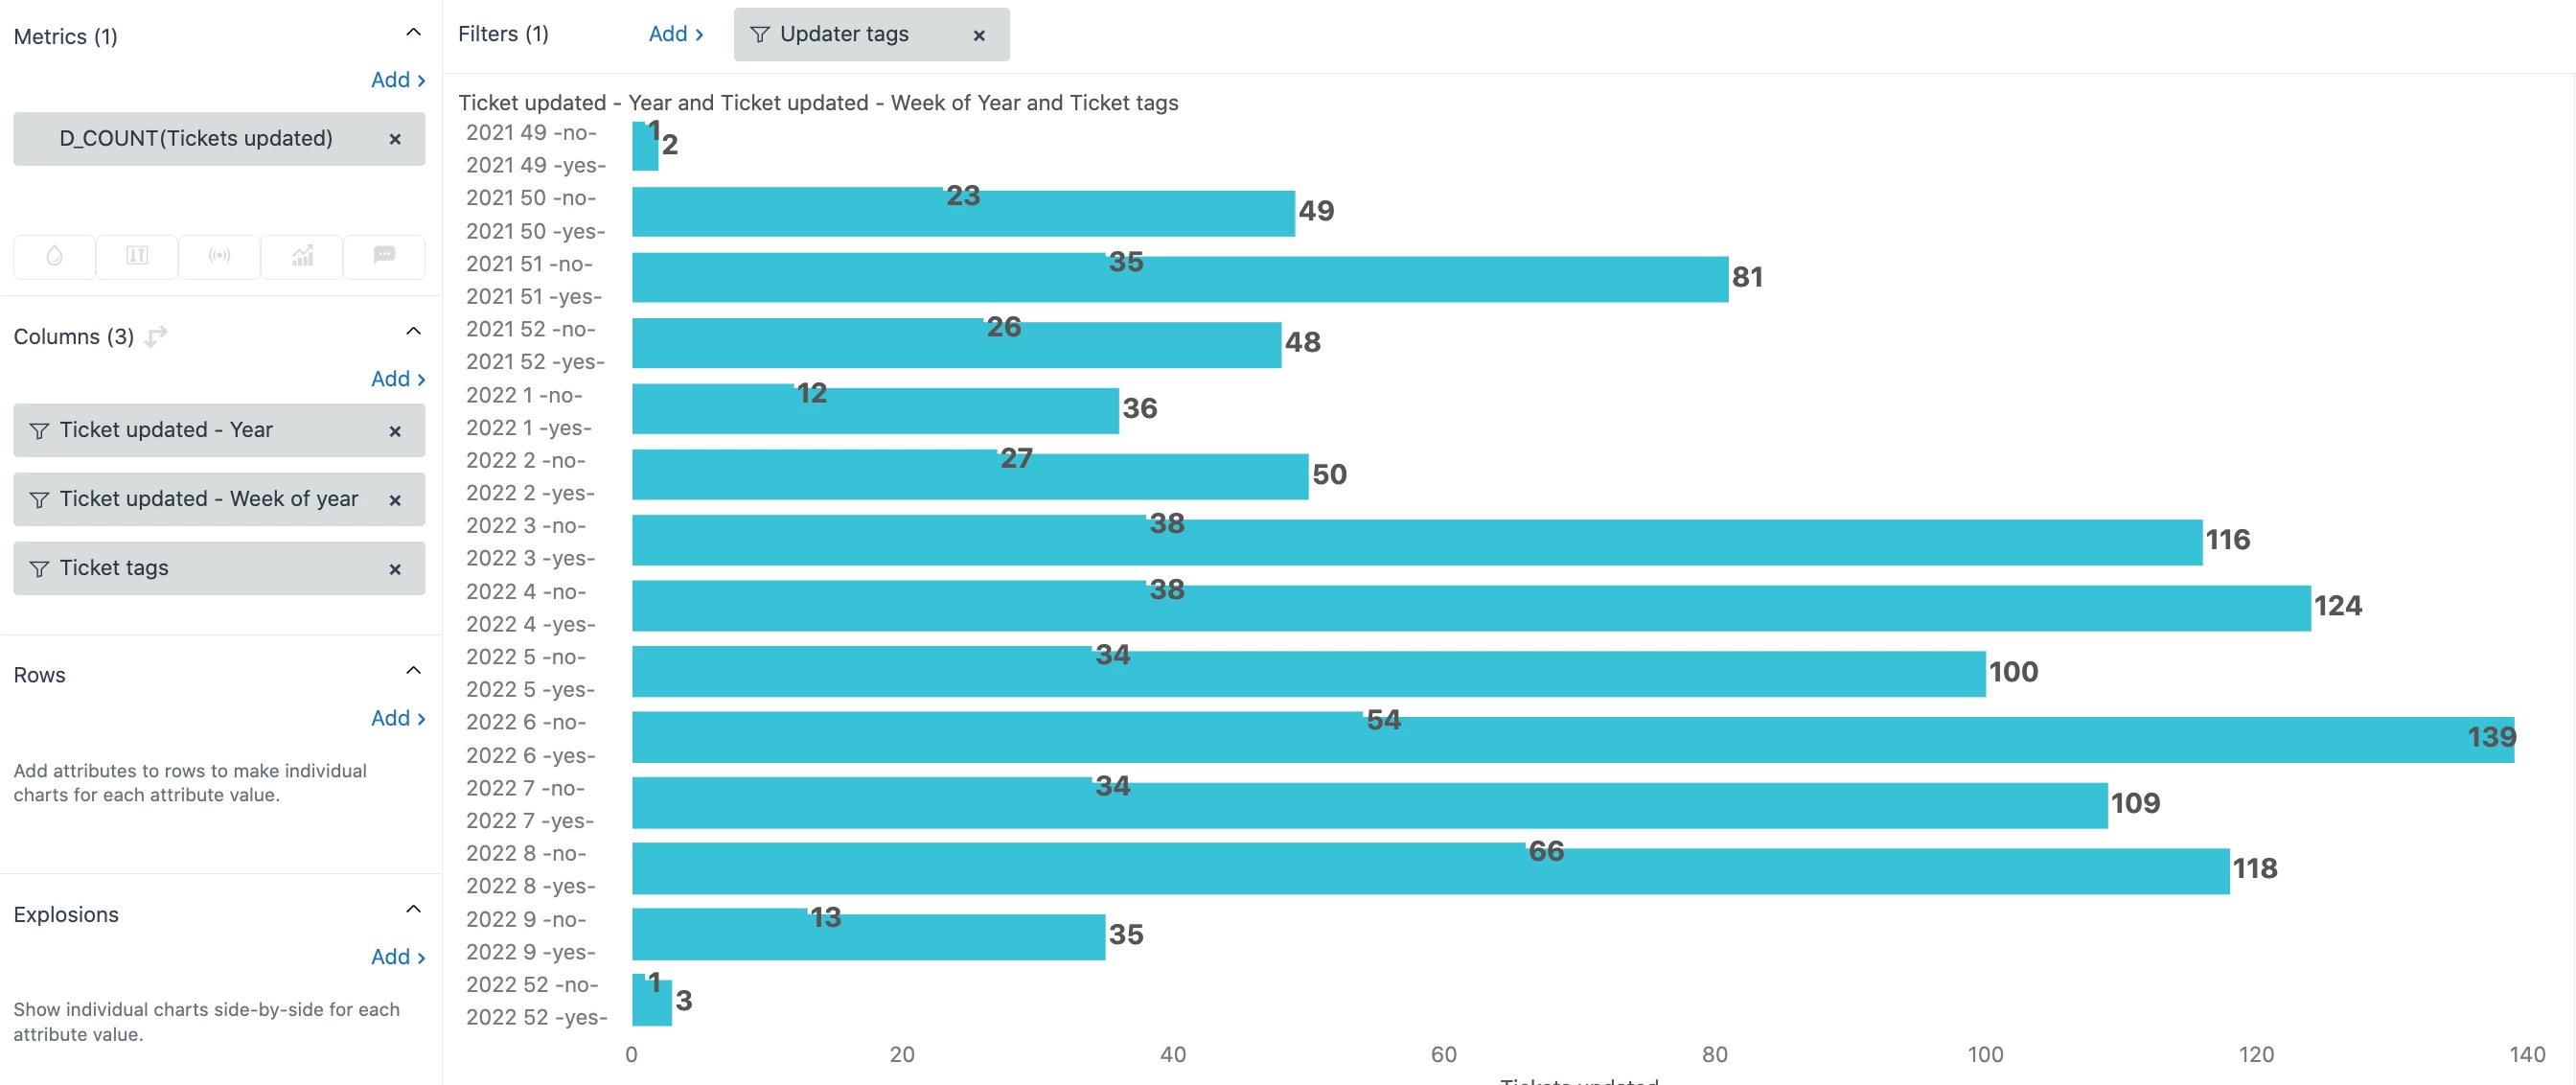
I'm trying to create a stacked chart between 2 ticket tags that we record each week, a simple Yes/No Tag.
I either want a way to show a stacked chart with the % difference between the Yes/No or a better way to compare the Yes/No on a week by week basis in 1 chart.
Below is an example any help will be appreciated: