Hi all,
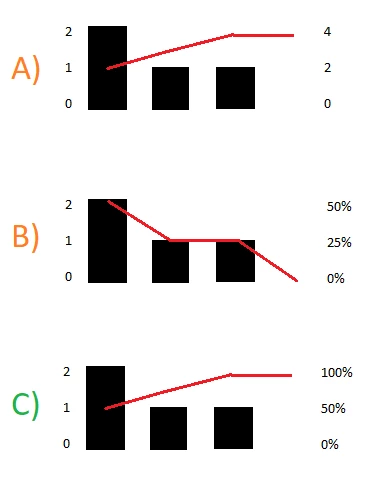
I'm wondering if there's any way to represent data as a running total in terms of percentage of all items, like in the line section of a pareto chart.
The closest I've gotten is using result path calculation, but that lets me either do running total or percentage of total, not both.
If that's not clear, this might help: on the furthest right, the chart should read 100%.
Thanks!