Hello,
I'm currently looking into building queries to monitor ticket performance for my team, and I'm a little confused by some apparent disparities in query results.
If you look at the two queries in dashboard below, one is set up to monitor response/resolution times, the second shows status times 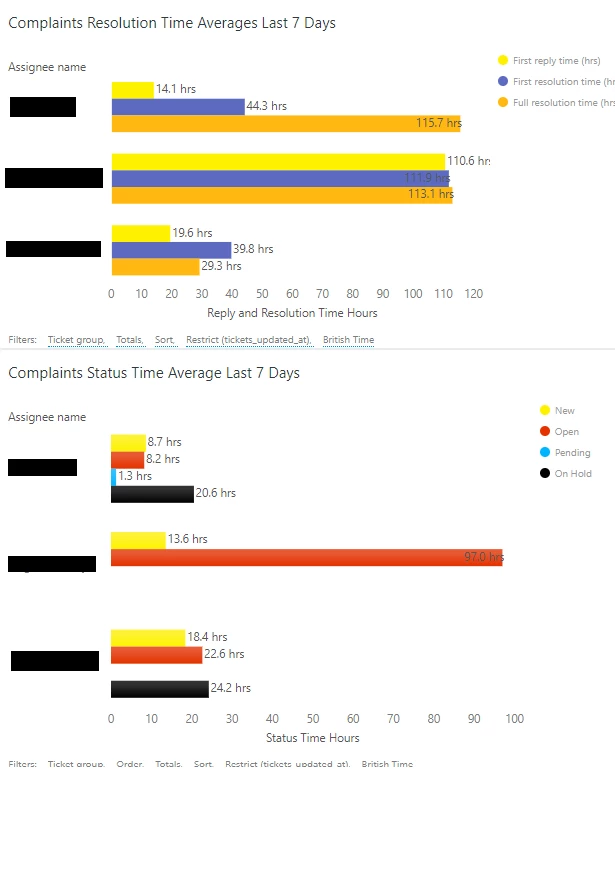
As you can see, there are significant differences in total times for resolution vs. total times for status, i'd have expected that status times added together would match resolution times given the ticket will have been in some kind of status until resolved.
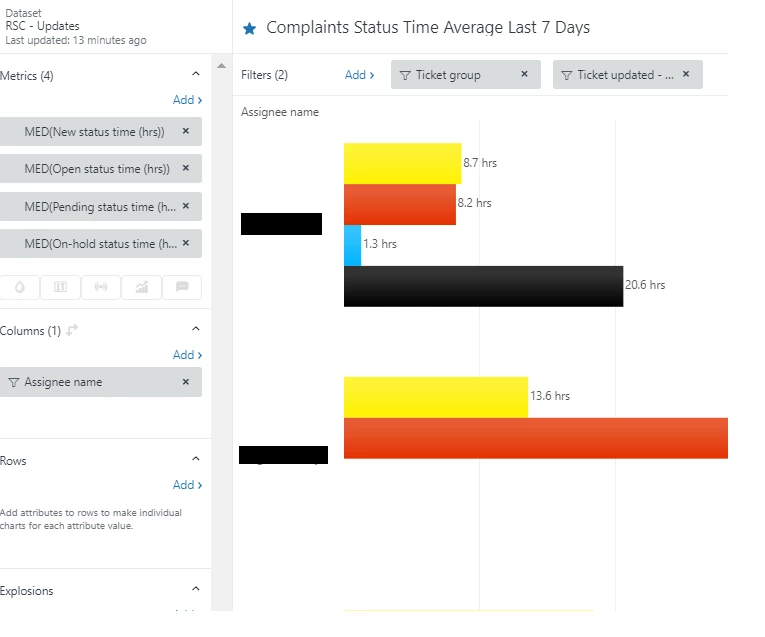
I've checked the queries and both of them are calculating by median, concern the same assignees, the same ticket group, and the same time period (7 days prior to today). These are the queries being used: 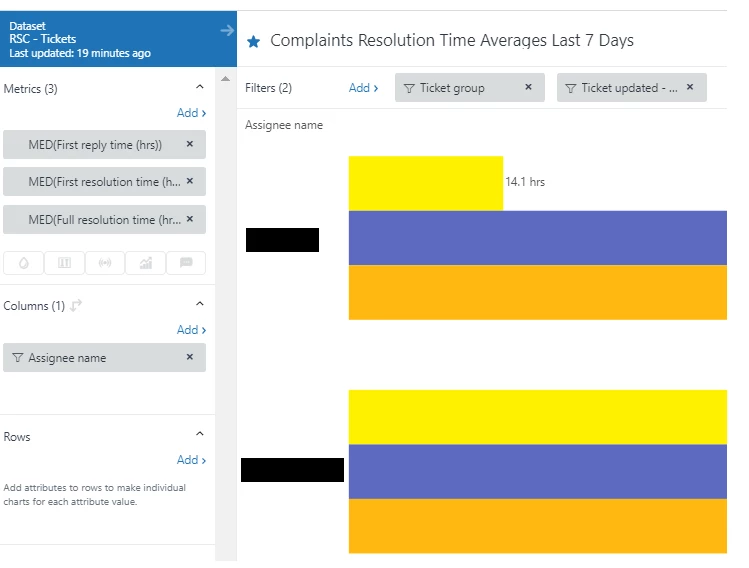
Can anyone explain the differences I'm seeing please?

Resolution time medians do not match status time medians
Login to the community
No account yet? Create an account
Enter your E-mail address. We'll send you an e-mail with instructions to reset your password.
Thanks for sharing.
A few difference I can think of for why the status times would not match up with resolution time.
That is what I can think of right away and this would be comparing individual tickets against each other for a group of tickets like you have here it would be even more complicated to compare against each other. But essentially I would say that it is not accurate to try to compare these two values against each other.
Best regards,