
Hi, I'm struggling with a specific type of report I'd like to build with Explore.
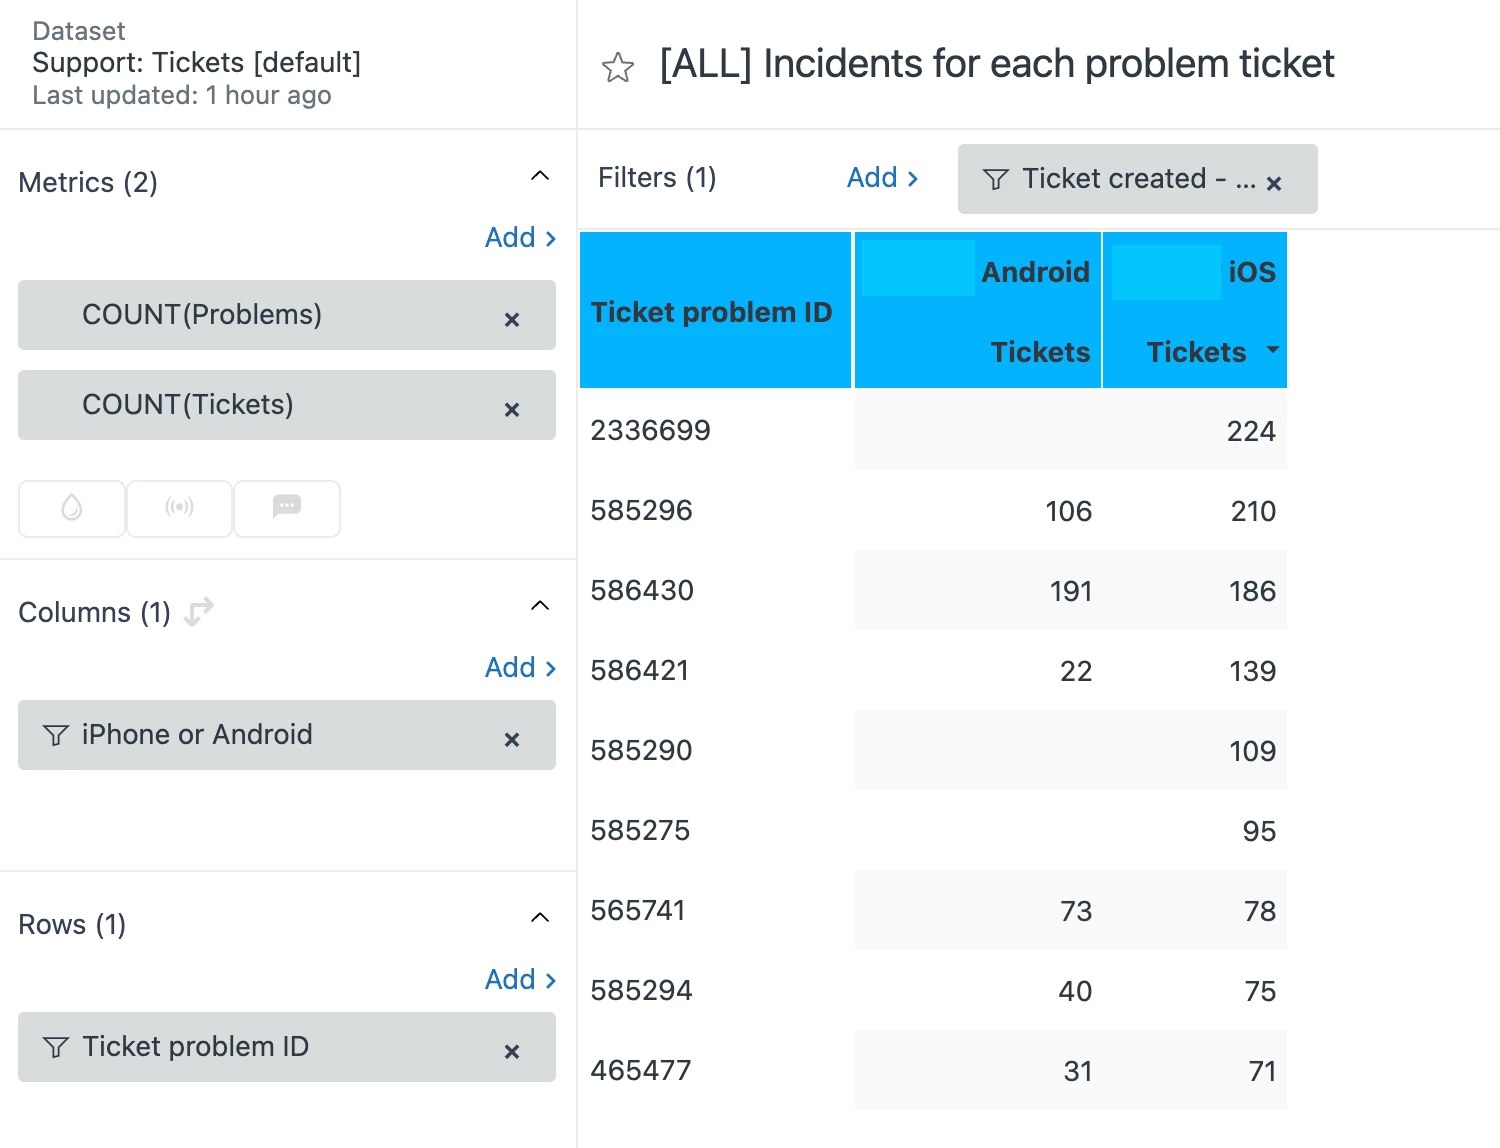
I created a report where I have a list of all of our Problem Tickets, and for each of them, the number of incidents for Android users and for iOS users of our app.
Here you can see how I made it (and I hope I did it well):
- in the Metrics I added COUNT(Problems) and COUNT(Tickets);
- in the Columns I selected the custom field we put in our tickets to map users as iPhone or Android users;
- in the Rows I chose Ticket Problem ID and I excluded NULL;
- and in the Filters I added a filter for tickets created this year.
Now, I wanted to clone this report into two more granular reports: one only for Problem Tickets that contain a specific tag, and the other only for Problem Tickets that contain another tag.
I tried to create a custom metric like this:
IF (INCLUDES_ALL([Ticket tags],"name_of_the_needed_tag")) THEN [Ticket ID]
ENDIF
And to use this new custom metric in place of COUNT(Problems).
But I can't for the life of me manage to make it work. No matter what I tried, the report ignores this custom metric and keeps showing all the Problem Tickets, instead of showing only the ones with that tag. As if COUNT(Problems) was still there under the Metrics, even if I removed it and I put my custom metric.
What should I do to make it work? Any help will be very welcome!