Is it possible to create a Cumulative Query on tickets volume? | Community
Skip to main content

Is it possible to create a Cumulative Query on tickets volume?

  • October 16, 2019
  • 4 replies
  • 0 views

Tommy12

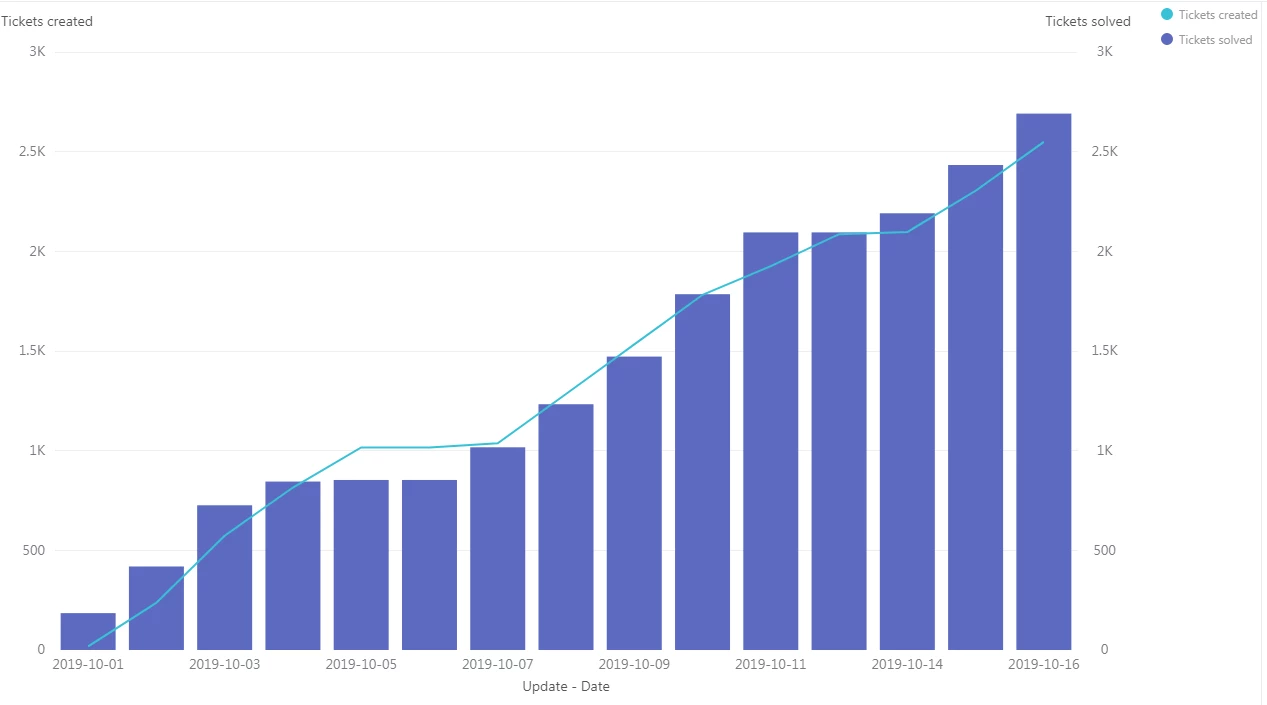
Hi there! I need to have a report in which I can see the total volume of tickets by status on a given day. So, if I have 20 new tickets per day and all of them are being solved, I would have:

1st day: 20 new 0 solved

2nd day: 20 new 20 solved

3rd day: 20 new 40 solved

Here is an inspiration for this: https://confluence.atlassian.com/jirasoftwarecloud/cumulative-flow-diagram-777002689.html

I would be very grateful if someone could point me in the right direction. Thank you!


4 replies

ZZ55
  • October 16, 2019

Anatolii

Try this:

Use the Support Ticket Updates dataset.

Metrics

  • Count Tickets Created

Then use the dual Access button to enter

  • D_COUNT( Tickets Solved)

Columns

  • Update Date

Filter

  • Update Date - select the date range that you want

Result Manipulation

  • Result Path Calculation

  • Chart Configuration > Auto

And that gave me:


Cardenas,
  • June 3, 2022

Hi,

i generate a similar  graphich based on a specific (number of tickets per month starting AND cumulative number of tickets).

Is there a way to hide the data values on the columns and keep only those in the cumulative line?

Romulo


Dane13
  • June 17, 2022
Hi Romulo,
 
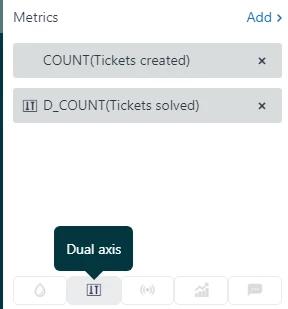
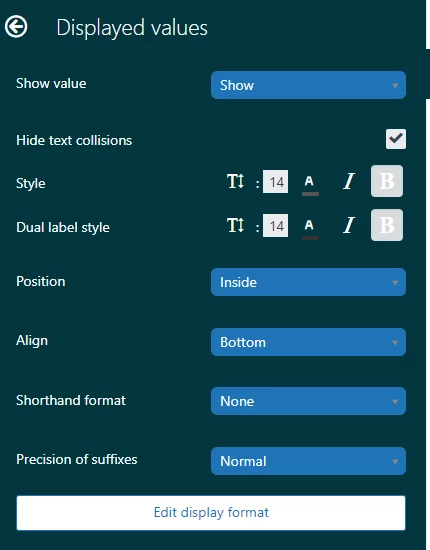
Are you pertaining to the column values highlighted in green?
 

As it turns out, there's no option to remove it on the current chart configuration.

Cardenas,
  • June 17, 2022

Hi Dane,


yes, both columns are displayed.