
Hi.
I'm a bit lost on why I'm getting two different sets of data from what is essentially the same query. I'd like to see all tickets that were solved in 1 touch or less. In Explore I'm using the following query:
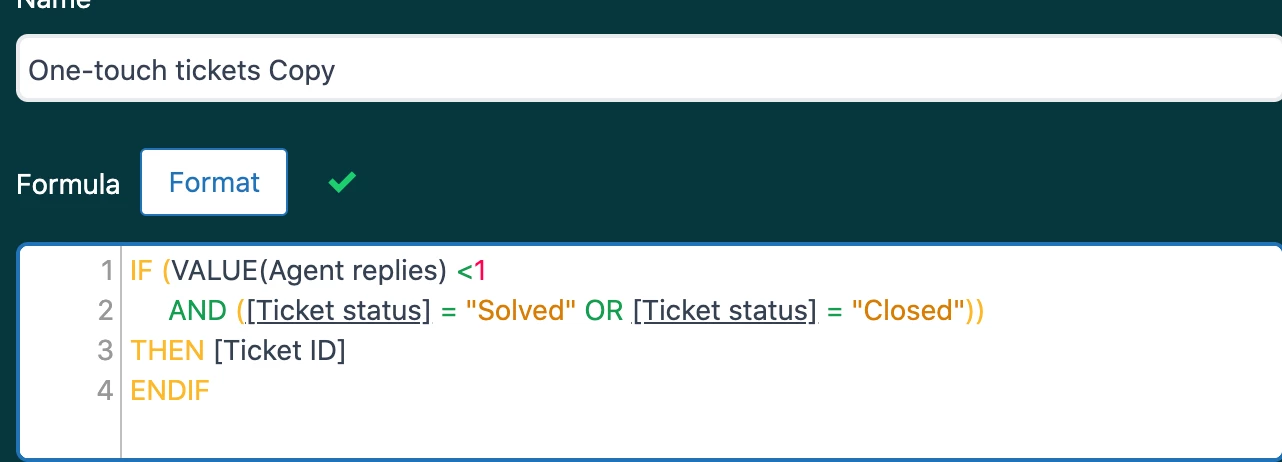
Where I'm trying to replicate this metric

Even having included the "Closed" status in my Explore query I still receive a much lower value than my insights chart is displaying. I'm sorting the data by week.
Any help here is appreciated!