I'm having some issues replicating a report from Insights to Explore and was curious if anyone had come across a similar situation.
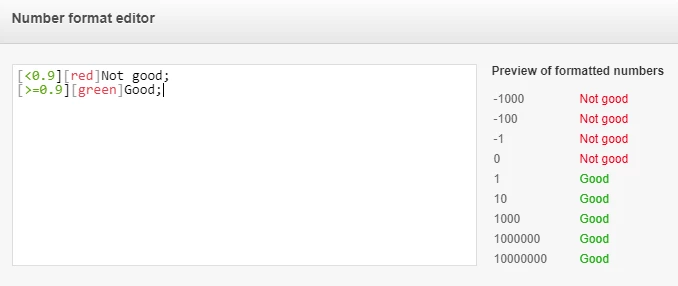
I want to display a calculated metric so it displays as text using a KPI visualisation. e.g. >=0.9 would display as "Good" and <0.9 would display as "Not good".
This used to be possible in Insights using the number format editor but I'm hitting a wall trying find a similar solution in Explore.