Hi all,
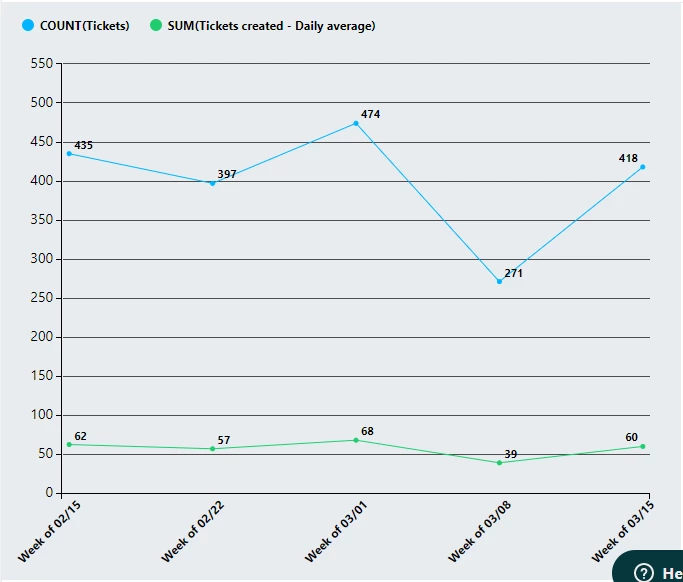
I've got an operational query which shows me the number of tickets created by date. The chart is a little bit all over the place(due to different volumes in different days) so it would be really useful to see what's the average number of tickets per 7 days/per calendar week.
Does anyone have any idea how can I add that as a second axis/trend line to the chart(if it's possible at all)?
Would be grateful for any advice on this.
Many thanks